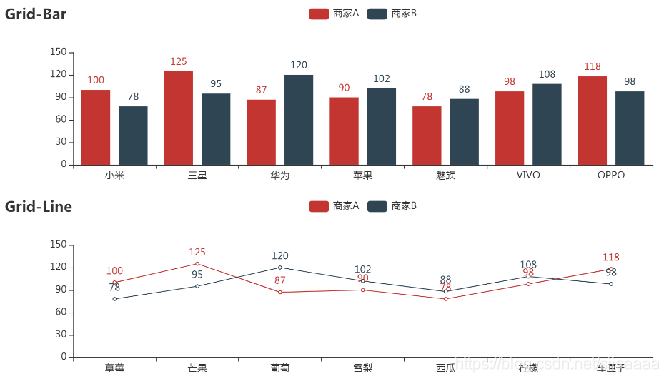
pyecharts可视化
pyecharts是基于Echart图表的一个类库,而Echart是百度开源的一个可视化JavaScript库。
简介:
pyecharts主要基于web浏览器进行显示,绘制的图形比较多,包括折线图、柱状图、饼图、漏斗图、地图、极坐标图等,代码量很少,而且很灵活,绘制出来的图形很美观。
使用pyecharts时,需要安装相应的库,安装命令为:pip install pyecharts
图形绘制过程,基本上所有的图表类型都是这样绘制的:
chart_name = Type()      #初始化具体类型图表
chart_name .add()         #添加数据及配置项
chart_name .render()
#生成本地文件(html/svg/jpeg/png/pdf/gif)
chart_name .render_notebook  #在jupyter notebook中显示
常用图表绘制
柱状图
利用Bar方法可以绘制柱状图
from pyecharts.charts import Bar
from pyecharts import options as opts
%matplotlib inline
# V1 版本开始支持链式调用
bar = ( Bar()
       .add_xaxis(["衬衫", "毛衣", "领带", "裤子", "风衣", "高跟鞋", "袜子"])
       .add_yaxis("商家A", [114, 55, 27, 101, 125, 27, 105])
       .set_global_opts(title_opts = opts.TitleOpts(title = "某商场销售情况")) )
bar.render_notebook()
#bar.render() 生成html 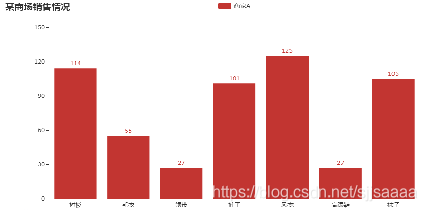
V1版本开始支持链式调用,如果不习惯链式调用的开发者依旧可以单独调用方法,上面代码为:
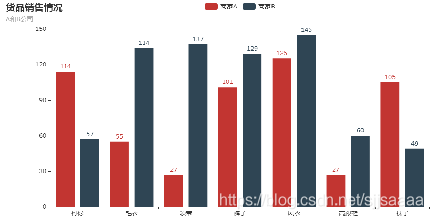
使用多个add_yaxis可以绘制并列柱状图。
bar = Bar()
bar.add_xaxis(["衬衫", "毛衣", "领带", "裤子", "风衣", "高跟鞋", "袜子"])
bar.add_yaxis("商家A", [114, 55, 27, 101, 125, 27, 105])
bar.set_global_opts(title_opts = opts.TitleOpts(title = "某商场销售情况"))
bar.render_notebook()
from pyecharts.charts import Bar from pyecharts import options as opts %matplotlib inline bar = Bar() bar.add_xaxis(["衬衫", "毛衣", "领带", "裤子", "风衣", "高跟鞋", "袜子"]) bar.add_yaxis("商家A", [114, 55, 27, 101, 125, 27, 105]) bar.add_yaxis("商家B", [57, 134, 137, 129, 145, 60, 49]) bar.set_global_opts(title_opts = opts.TitleOpts(title = "货品销售情况",subtitle = "A和B公司")) bar.render_notebook()
#### [](https://blog.csdn.net/sjjsaaaa/article/details/111824696)饼图
饼图常用于表现不同类别的占比情况。利用Pie方法可以绘制饼图。
from pyecharts import options as opts
from pyecharts.charts import Page, Pie
L1=['教授','副教授','讲师','助教','其他']
num = [20,30,10,12,8]
c = Pie()
c.add("", [list(z) for z in zip(L1,num)])
c.set_global_opts(title_opts=opts.TitleOpts(title="Pie-职称类别比例"))
c.set_series_opts(label_opts=opts.LabelOpts(formatter="{b}: {c}"))
c.render_notebook()
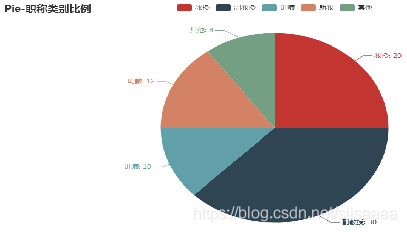
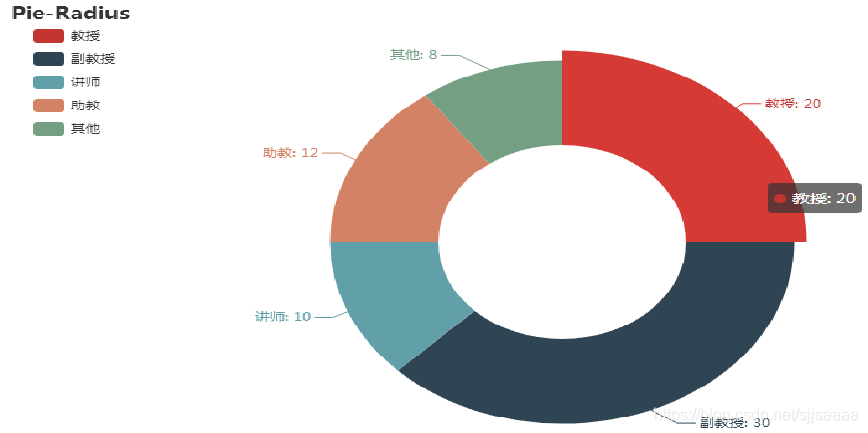
通过参数圆形饼图radius可以绘制圆形饼图。
from pyecharts import options as opts from pyecharts.charts import Page, Pie wd = ['教授','副教授','讲师','助教','其他'] num = [20,30,10,12,8] c = Pie() c.add("",[list(z) for z in zip(wd, num)],radius = ["40%", "75%"])
圆环的粗细和大小
c.set_global_opts( title_opts=opts.TitleOpts(title="Pie-Radius"),legend_opts=opts.LegendOpts( orient="vertical", pos_top="5%", pos_left="2%" )) c .set_series_opts(label_opts=opts.LabelOpts(formatter="{b}: {c}")) c.render_notebook()
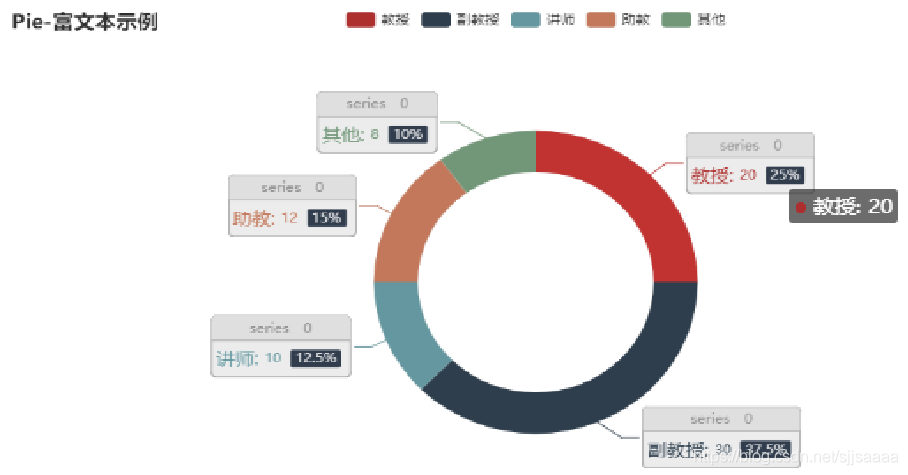
可以通过rich参数设置更多属性
c = Pie() c.add("",[list(z) for z in zip(wd, num)],radius=["40%", "55%"], label_opts=opts.LabelOpts(position="outside", formatter="{a|{a}}{abg|}\n{hr|}\n{b|{b}:}{c} {per|{d}%} ", background_color="#eee",border_color="#aaa", border_width=1,border_radius=4, rich={"a": {"color": "#999", "lineHeight": 22, "align": "center"},"abg": {"backgroundColor": "#e3e3e3","width": "100%", "align": "right", "height": 22,"borderRadius": [4, 4, 0, 0],}, "hr": {"borderColor": "#aaa", "width": "100%","borderWidth": 0.5, "height": 0,}, "b": {"fontSize": 16, "lineHeight": 33},"per": {"color": "#eee","backgroundColor": "#334455", "padding": [2, 4],"borderRadius": 2,} } )) c.set_global_opts(title_opts=opts.TitleOpts(title="Pie-富文本示例")) c.render_notebook()
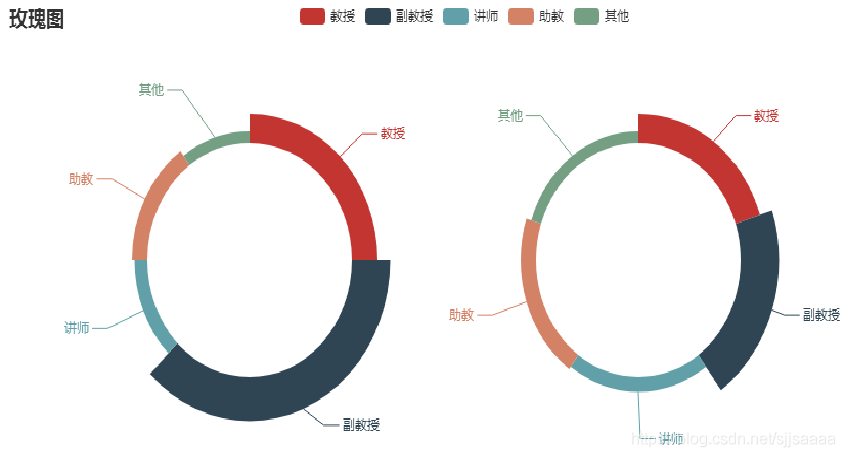
玫瑰图绘制
from pyecharts.faker import Faker from pyecharts import options as opts from pyecharts.charts import Page, Pie data = [45,86,39,52,68] labels = ['电脑','手机','彩电','冰箱','洗衣机'] c = Pie() c.add("",[list(z) for z in zip(wd, num)],radius=["40%", "55%"],center=[240,220],rosetype='radius') c.add("",[list(z) for z in zip(wd, num)],radius=["40%", "55%"],center=[620,220],rosetype='area') c.set_global_opts(title_opts=opts.TitleOpts(title="玫瑰图")) c.render_notebook()
#### [](https://blog.csdn.net/sjjsaaaa/article/details/111824696)漏斗图
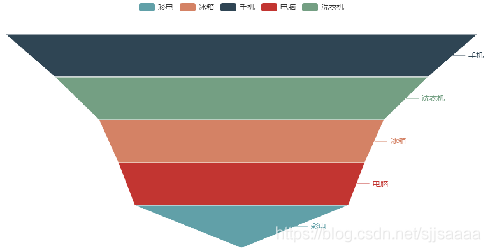
pyecharts中通过Funnel绘制漏斗图。
from pyecharts.charts import Funnel from pyecharts import options as opts %matplotlib inline data = [45,86,39,52,68] labels = ['电脑','手机','彩电','冰箱','洗衣机'] wf = Funnel() wf.add('电器销量图',[list(z) for z in zip(labels, data)], is_selected= True) wf.render_notebook()
#### [](https://blog.csdn.net/sjjsaaaa/article/details/111824696)散点图
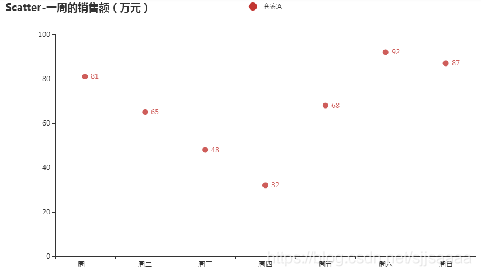
pyecharts利用Scatter绘制散点图。
from pyecharts import options as opts from pyecharts.charts import Scatter week = ["周一", "周二", "周三", "周四", "周五", "周六", "周日"] c = Scatter() c.add_xaxis(week) c.add_yaxis("商家A", [81,65,48,32,68,92,87]) c.set_global_opts(title_opts=opts.TitleOpts(title="Scatter-一周的销售额(万元)")) c.render_notebook()
#### [](https://blog.csdn.net/sjjsaaaa/article/details/111824696)K线图
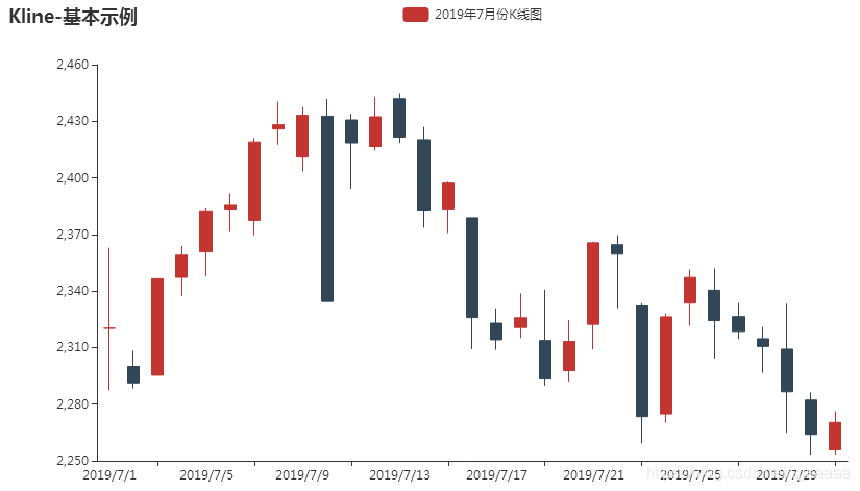
pyecharts利用Kline绘制K线图。
from pyecharts import options as opts from pyecharts.charts import Kline data = [[2320.26, 2320.26, 2287.3, 2362.94],[2300, 2291.3, 2288.26, 2308.38],[2295.35, 2346.5, 2295.35, 2345.92]] c = Kline() c.add_xaxis(["2019/7/{}".format(i + 1) for i in range(31)]) c.add_yaxis("2019年7月份K线图", data) c.set_global_opts(yaxis_opts=opts.AxisOpts(is_scale=True), xaxis_opts=opts.AxisOpts(is_scale=True), title_opts=opts.TitleOpts(title="Kline-基本示例"),) c.render_notebook()
#### [](https://blog.csdn.net/sjjsaaaa/article/details/111824696)仪表盘
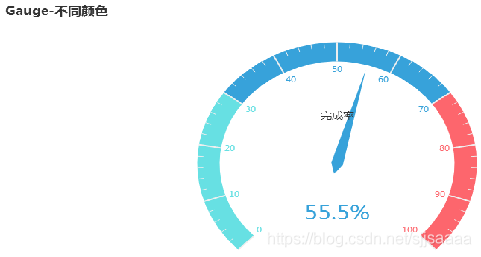
pyecharts利用Gauge绘制仪表盘。
from pyecharts import options as opts from pyecharts.charts import Gauge, Page c = Gauge() c.add("业务指标",[("完成率", 55.5)],axisline_opts=opts.AxisLineOpts( linestyle_opts=opts.LineStyleOpts(color=[(0.3, "#67e0e3"), (0.7, "#37a2da"), (1, "#fd666d")], width=30))) c.set_global_opts(title_opts=opts.TitleOpts(title="Gauge-不同颜色"), legend_opts=opts.LegendOpts(is_show=False)) c.render_notebook()
#### [](https://blog.csdn.net/sjjsaaaa/article/details/111824696)词云
Pyecharts利用WordCloud绘制词云。
from pyecharts import options as opts from pyecharts.charts import Page, WordCloud from pyecharts.globals import SymbolType words = [ ("牛肉面", 7800),("黄河", 6181), ("《读者》杂志", 4386), ("甜胚子", 3055), ("五泉山", 2550)] c = WordCloud() c.add("", words, word_size_range=[20, 80]) c.set_global_opts(title_opts=opts.TitleOpts(title="WordCloud-基本示例")) c.render_notebook()

#### [](https://blog.csdn.net/sjjsaaaa/article/details/111824696)地图
自从 0.3.2 开始,为了缩减项目本身的体积以及维持 pyecharts 项目的轻量化运行,pyecharts 将不再自带地图 js 文件。如用户需要用到地图图表(Geo、Map),可自行安装对应的地图文件包。
Windows下通过以下的pip命令进行安装:
#安装全球国家地图,包括世界地图和 213 个国家 pip install echarts-countries-pypkg #安装中国省级地图,包括23 个省,5 个自治区 pip install echarts-china-provinces-pypkg #中国市级地图,包括370 个中国城市 pip install echarts-china-cities-pypkg
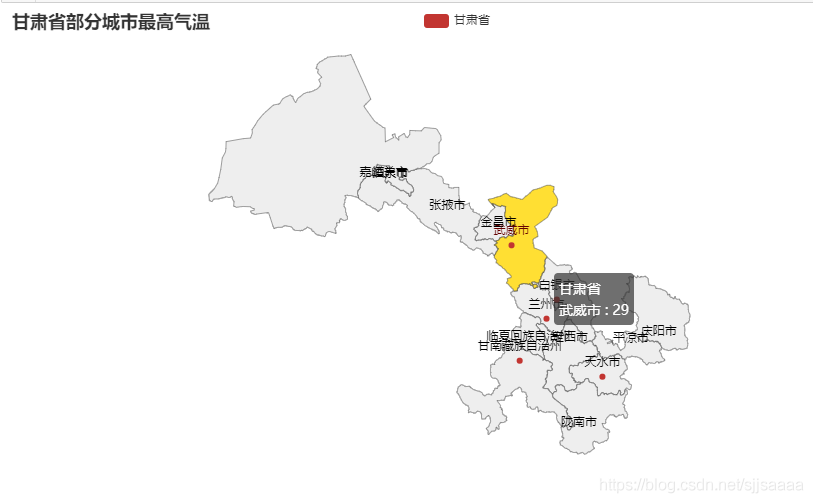
在指定地图上的城市标示某天最高温度
from pyecharts import options as opts from pyecharts.charts import Map temperature=[30,31,27,29,18] loc = ['兰州市','天水市','白银市','武威市','甘南藏族自治州'] c = Map() c.add("甘肃省", [list(z) for z in zip(loc, temperature)], "甘肃",is_roam=True)
is_roam是否开启鼠标缩放和平移漫游
c .set_global_opts(title_opts=opts.TitleOpts(title="甘肃省部分城市最高气温")) c.render_notebook()
#### [](https://blog.csdn.net/sjjsaaaa/article/details/111824696)组合图表
