使用requests模块来请求网站数据
 1 import requests
 2
 3
 4 #执行API调用并存储响应
 5 url = 'https://api.github.com/search/repositories?q=language:python&sort=stars'
 6 r = requests.get(url)
 7 print("Statuscode:", r.status_code)
 8
 9 #将API响应存储在一个变量中
10 response_dict = r.json()
11 print("Repositories returned:", response_dict['total_count'])#包含仓库总数
12
13 #探索有关仓库的信息
14 repo_dicts = response_dict['items']
15 print("Repositories returned:", len(repo_dicts))
16
17 #研究第一个仓库
18 repo_dict = repo_dicts[0]
19 print("\nKeys:", len(repo_dict))
20 for key in sorted(repo_dict.keys()):
21     print(key)
22
23 print("\nSelected information about first repository:")
24 print('Name:', repo_dict['name'])
25 print('Owner:', repo_dict['owner']['login'])
26 print('Stars:', repo_dict['stargazers_count'])
27 print('Repository:', repo_dict['html_url'])
28 print('Created:',repo_dict['created_at'])
29 print('Updated:', repo_dict['updated_at'])
30 print('Description:', repo_dict['description'])
Output:
-------snip--------
Selected information about first repository:
Name: awesome-python
Owner: vinta
Stars: 66036
Repository: https://github.com/vinta/awesome-python
Created: 2014-06-27T21:00:06Z
Updated: 2019-04-19T12:49:58Z
Description: A curated list of awesome Python frameworks, libraries, software and resources
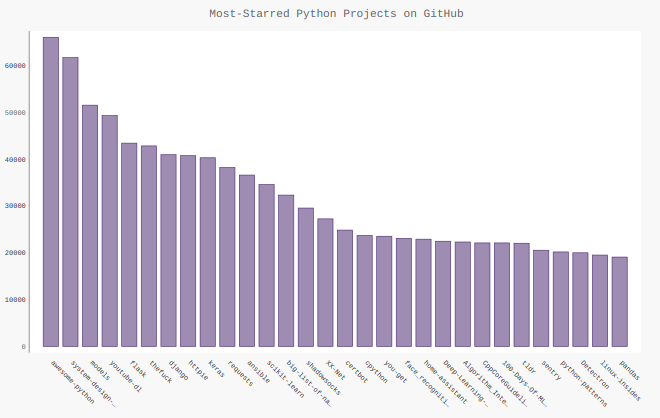
使用Pygal可视化仓库:
添加一个参数配置来定义图表参数,自定义图表中每个条形的描述信息以及可单击的链接
 1 mport requests
 2 import pygal
 3 from pygal.style import LightColorizedStyle as LCS, LightenStyle as LS
 4
 5
 6 #执行API调用并存储响应
 7 url = 'https://api.github.com/search/repositories?q=language:python&sort=stars'
 8 r = requests.get(url)
 9 print("Statuscode:", r.status_code)
10
11 #将API响应存储在一个变量中
12 response_dict = r.json()
13 print("Repositories returned:", response_dict['total_count'])#包含仓库总数
14
15 #探索有关仓库的信息
16 repo_dicts = response_dict['items']
17
18 names, plot_dicts = [], []
19 for repo_dict in repo_dicts:
20     names.append(repo_dict['name'])
21     plot_dict ={
22         'value': repo_dict['stargazers_count'],
23         'label': str(repo_dict['description']),
24         'xlink': repo_dict['html_url']
25     }
26     plot_dicts.append(plot_dict)
27 #可视化
28 my_style = LS('#333366', base_style=LCS)
29
30 my_config = pygal.Config()#创建配置实例
31 my_config.x_label_rotation = 45#X轴标签顺时针旋转45度
32 my_config.show_legend = False#隐藏图例
33 my_config.title_font_size = 24#图表标题字体大小
34 my_config.label_font_size = 14#副标签
35 my_config.major_label_font_size = 18#主标签,Y轴上为5000整数倍的刻度,不是很明白这个是怎么回事
36 my_config.truncate_label = 15#将较长的项目名缩短为15个字符
37 my_config.show_y_guides = False#隐藏图表中的水平线
38 my_config.width = 1000#自定义表宽
39
40 chart = pygal.Bar(my_config, style=my_style)
41 chart.title = 'Most-Starred Python Projects on GitHub'
42 chart.x_labels = names
43
44 chart.add('', plot_dicts)
45 chart.render_to_file('python_repos.svg')
Figure:

使用Hacker News API:
通过一个API调用获取其上当前热门文章的ID,再查看前30篇文章,打印其标题、到讨论页面的链接以及文章现有的评论数。(这里运行报错应该是爬虫的问题,小白表示
目前不知道咋整,只附代码。)
 1 import requests
 2 from operator import itemgetter
 3
 4
 5 url = 'https://hacker-news.firebaseio.com/v0/topstories.json'
 6 r = requests.get(url)
 7 print("Status code:", r.status_code)
 8
 9 submission_ids = r.json()
10 submission_dicts = []
11 for submission_id in submission_ids[:30]:
12     url = ('http://hacker-news.firebase.com/v0/item/' +
13            str(submission_id) + '.json')
14     submission_r = requests.get(url)
15     print(submission_r.status_code)
16     response_dict = submission_r.json()
17
18     submission_dict = {
19         'title': response_dict['title'],
20         'link': 'http://news.ycombinator.com/item?id=' + str(submission_id),
21         'comments': response_dict.get('descendants', 0)
22     }
23     submission_dicts.append(submission_dict)
24
25 submission_dicts = sorted(submission_dicts, key=itemgetter('comments'),
26                           reverse=True)
27 for submission_dict in submission_dicts:
28     print("\nTitle:", submission_dict['title'])
29     print("Discussion link:", submission_dict['link'])
30     print("Comments:", submission_dict['comments'])


