ECharts常用图例

Stella981
• 阅读 574

最近做了一个统计报表的功能,画了一周的原型图,一直找,找到了很多插件图,最后选择用下面几个图:

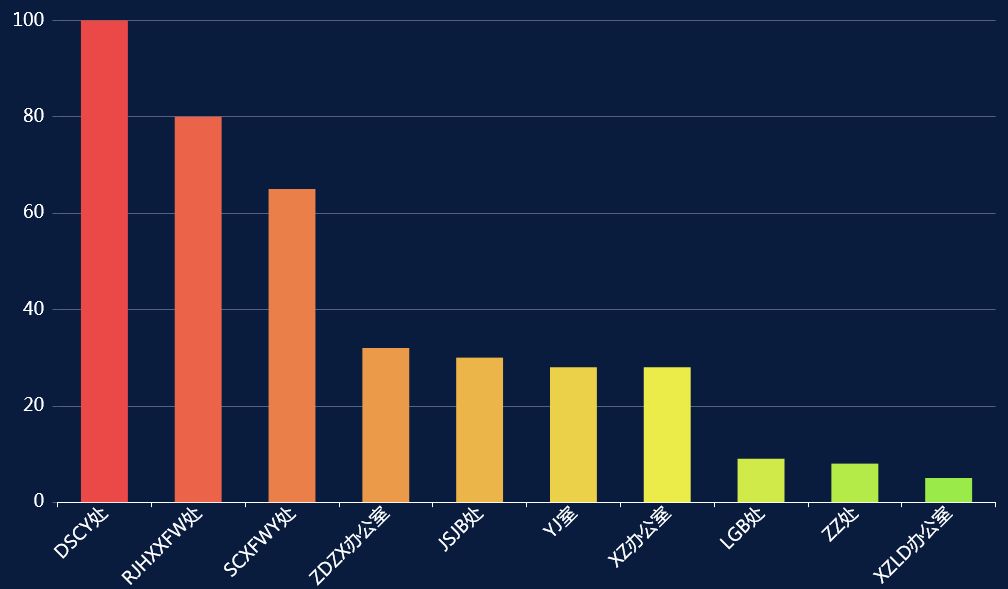
1.柱形图:
ECharts常用图例

var jdData = ['DSCY处','RJHXXFW处','SCXFWY处','ZDZX办公室','JSJB处','YJ室','XZ办公室','LGB处','ZZ处','XZLD办公室']
var data1 = [100,80,65,32,30,28,28,9,8,5];
option = {
    baseOption: {
    timeline: {
        axisType: 'category',
        show: false,
        autoPlay: false,
    },
        backgroundColor:'#091C3D',
        title: {

            'text': '',
            'subtext': '',
            textStyle:{
                color:'#fff'
                },
            left:'center'
        },
        tooltip: {
            'trigger': 'axis'
        },

        calculable: true,
        grid: {
            left: '2%',
            right: '2%',
            bottom: '12%',
            top:'4%',
            containLabel: true
        },
        label:{
            normal:{
                textStyle:{
                    color:'#fff'
                    }
                }
            },
        xAxis: [{
            splitNumber:0,
            'type': 'category',
            data: jdData,
            nameTextStyle:{
                color:'#fff'
                },
            axisLabel:{
                rotate:45,
                textStyle:{
                    fontSize:18,
                    color:'#fff',
                },
                interval: 0
            },
            axisLine:{
                lineStyle:{
                    color:'#fff'
                   },
                },
           
                
        }],
        yAxis: [{
            'type': 'value',
            'name': '', 
            splitNumber:0,
            nameTextStyle:{
                color:'#56617b'
                },
            axisLine:{
                show:false,
                lineStyle:{
                    color:'#56617b'
                   }
                },
            axisLabel: {
                textStyle:{
                    fontSize:18,
                    color:'#fff',
                },
                formatter: '{value} '
            },
            splitLine:{
                show:true,
                lineStyle:{
                    color:'#56617b'
                }
             },
        }],
        series: [{
            'name': '',
            'type': 'bar',
            markLine : {
                label:{
                    normal:{
                        show:false
                        }
                    },
                lineStyle:{
                    normal:{
                        color:'red',
                        width:3
                        }
                    }, 
            },
            barWidth:'50%',
            itemStyle: {
                normal: {
                    color: function(params) {
                        // build a color map as your need.
                        var colorList = [
                          '#eb4848','#eb6449','#eb7f49','#eb9a49','#ebb549',
                           '#ebd049','#ebeb49','#d0eb49','#b5eb49','#9aeb49'
                        ];
                        return colorList[params.dataIndex]
                    },
                    
                }
            },
        }]
    },
    options: [ {
        title: {
            'text': ''
        },
        series: [{
            'data': data1
        }]
    }, ]
};

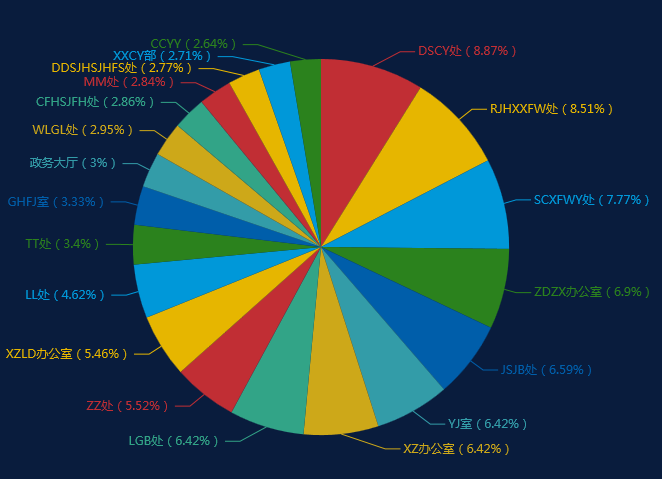
2.饼图
ECharts常用图例

var data = [{
    "value": 23988,
    "name": "对外经贸合作"
}, {
    "value": 23017,
    "name": "科技"
}, {
    "value": 21013,
    "name": "文化体育"
}, {
    "value": 18650,
    "name": "金融"
}, {
    "value": 17820,
    "name": "教育"
}, {
    "value": 17356,
    "name": "基础设施"
}, {
    "value": 17355,
    "name": "物流"
}, {
    "value": 17343,
    "name": "能源"
}, {
    "value": 14928,
    "name": "铁路"
}, {
    "value": 14752,
    "name": "国内贸易"
}, {
    "value": 12484,
    "name": "旅游"
}, {
    "value": 9184,
    "name": "农林牧渔"
}, {
    "value": 8999,
    "name": "重大项目"
}, {
    "value": 8108,
    "name": "环境保护"
}, {
    "value": 7985,
    "name": "公路"
}, {
    "value": 7720,
    "name": "电力"
}, {
    "value": 7684,
    "name": "民航"
}, {
    "value": 7487,
    "name": "医药卫生"
}, {
    "value": 7318,
    "name": "信息产业"
}, {
    "value": 7141,
    "name": "民族宗教"
}];
var count_num = 0;
for (var m in data) {
    count_num = count_num + data[m]['value']
}
/*for (var n  in data){
    data[n]['name'] = data[n]['name'] + ' '+((data[n]['value']/count_num)*100).toFixed(1) +'%'
}*/

option = {
    backgroundColor: "#000",
    title: {
        text: '“一带一路”沿线省区市关注领域',
        subtext: '纯属虚构',
        x: 'center',
        top: '30',
        textStyle: {
            color: "#fff",
        }
    },
    //显示series中信息,提示框组件
    tooltip: {
        trigger: 'item',
        formatter: "{a} <br/>{b} : {c} ({d}%)"
    },

    series: [{
        type: 'pie', //图表类型,柱状图:bar
        //饼图:pie  (南丁格尔图在series中加上roseType:’angle’)移开后不显示原来信息
        radius: '55%', //半径
        center: ['50%', '50%'],
        label: {
            formatter: "{b}+{d}%"
        },
        data: data,
        itemStyle: { //itemStyle有正常显示:normal,有鼠标hover的高亮显示:emphasis
            emphasis: { //normal显示阴影,与shadow有关的都是阴影的设置
                shadowBlur: 10, //阴影大小
                shadowOffsetX: 0, //阴影水平方向上的偏移
                shadowColor: 'rgba(0, 0, 0, 0.5)' //阴影颜色
            }
        }
    }]
};

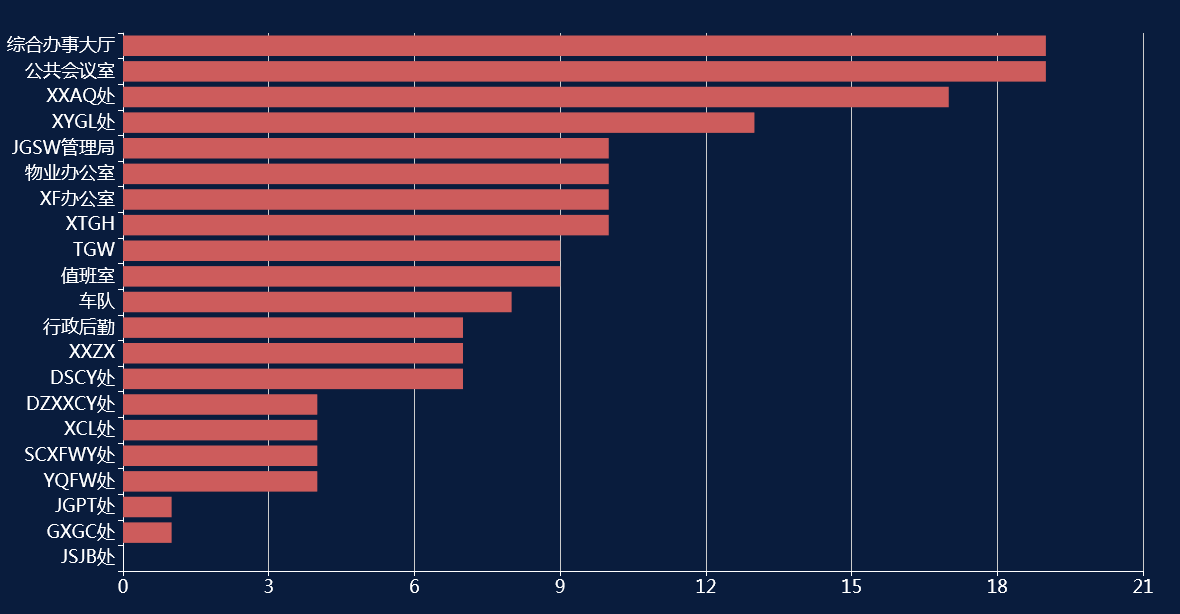
3.横向柱状图:
ECharts常用图例

option = {
     backgroundColor:'#091C3D',
    color: ["#cd5c5c"],
    textStyle: {
        color: '#fff'
    },
    tooltip: {
        trigger: 'axis',
        axisPointer: {
            type: 'shadow'
        },
        formatter: "{a} <br/>{b} : {c}台"
    },

    grid: {

        containLabel: true
    },
    xAxis: {

        type: 'value',
        boundaryGap: [0, 0.01],
        axisLine:{
            lineStyle:{
            color:'#fff'
                      },
                  },
        "axisLabel": {
            "interval": 0,
            fontSize: 18,
            formatter: '{value}',
        }
    },
    yAxis: {
         axisLine:{
            lineStyle:{
            color:'#fff'
                      },
                  },
        "axisLabel": {
            "interval": 0,
            fontSize: 18,
        },
        type: 'category',
        data: [
            '综合办事大厅',
            '公共会议室',
            'XXAQ处',
            'XYGL处',
            'JGSW管理局',   
            '物业办公室',
            'XF办公室',
            'XTGH',
            'TGW',
            '值班室',
            '车队',
            '行政后勤',
            'XXZX',
            'DSCY处',
            'DZXXCY处',
            'XCL处',
            'SCXFWY处',
            'YQFW处',
            'JGPT处',
            'GXGC处',
            'JSJB处',
            
        ].reverse()
    },
    series: [{
        name: '活跃终端数量:',
        type: 'bar',
    
        data: [19,19, 17,  13,10, 10,10, 10, 9, 9, 8, 7,7, 7, 4, 4, 4,4, 1,1, 0].reverse(),

    }]
};

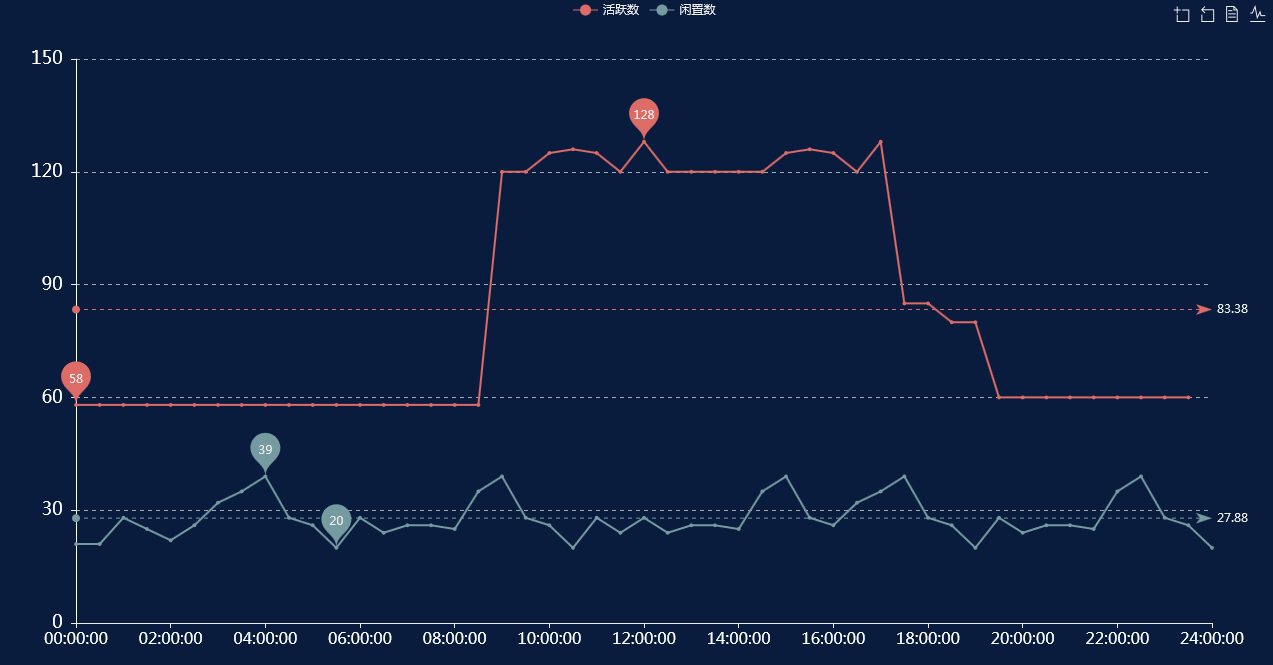
4.折线图:
ECharts常用图例

 option = {
     backgroundColor: '#091C3D',
     title: {},
     tooltip: {
         trigger: 'axis'
     },
     legend: {
         splitNumber: 0,
         data: ['活跃数', '闲置数'],
         nameTextStyle: {
             color: '#fff'
         },
     },
     toolbox: {
         show: true,
         feature: {
             dataZoom: {},
             dataView: {
                 readOnly: false
             },
             magicType: {
                 type: ['line', 'bar']
             },
             restore: {},
             saveAsImage: {}
         }
     },
     xAxis: [{
         type: 'category',
         boundaryGap: false,
         data: ['00:30:00', '01:00:00', '01:30:00', '02:00:00', '02:30:00', '03:00:00', '03:30:00', '04:00:00', '04:30:00', '05:00:00', '05:30:00', '06:00:00', '06:30:00', '07:00:00', '07:30:00', '08:00:00', '08:30:00', '09:00:00', '09:30:00', '10:00:00', '10:30:00', '11:00:00', '11:30:00', '12:00:00',
             '12:30:00', '13:00:00', '13:30:00', '14:00:00', '14:30:00', '15:00:00', '15:30:00', '16:00:00', '16:30:00', '17:00:00', '17:30:00', '18:00:00', '18:30:00', '19:00:00', '19:30:00', '20:00:00', '20:30:00', '21:00:00', '21:30:00', '22:00:00', '22:30:00', '23:00:00', '23:30:00', '24:00:00'
         ],
     }],
     yAxis: [{
         type: 'value',
         axisLabel: {
             textStyle: {
                 fontSize: 18,
                 color: '#fff',
             },
             formatter: '{value} '
         },
         axisLine: {
             show: true,
             lineStyle: {
                 color: '#fff'
             }
         },
     }],
     series: [{
             name: '活跃数',
             type: 'line',
             data: [58, 58, 58, 58, 58, 58, 58, 58, 58, 58, 58, 58, 58, 58, 58, 58, 58, 58, 120, 120, 125, 126, 125, 120, 128, 120, 120, 120, 120, 120, 125, 126, 125, 120, 128, 85, 85, 80, 80, 60, 60, 60, 60, 60, 60, 60, 60, 60, ],
             markPoint: {
                 data: [{
                         type: 'max',
                         name: '最大值'
                     },
                     {
                         type: 'min',
                         name: '最小值'
                     }
                 ]
             },
             markLine: {
                 data: [{
                     type: 'average',
                     name: '平均值'
                 }]
             }
         },
         {
             name: '闲置数',
             type: 'line',
             data: [21, 28, 25, 22, 26, 32, 35, 39, 28, 26, 20, 28, 24, 26, 26, 25, 35, 39, 28, 26, 20, 28, 24, 28, 24, 26, 26, 25, 35, 39, 28, 26, 32, 35, 39, 28, 26, 20, 28, 24, 26, 26, 25, 35, 39, 28, 26, 20, 28, 24, ],
             markPoint: {
                 data: [{
                         type: 'max',
                         name: '最大值'
                     },
                     {
                         type: 'min',
                         name: '最小值'
                     }
                 ]
             },
             markLine: {
                 data: [{
                     type: 'average',
                     name: '平均值'
                 }]
             }
         }
     ]
 };
点赞
收藏
评论区
推荐文章
待兔 待兔
2个月前
手写Java HashMap源码
HashMap的使用教程HashMap的使用教程HashMap的使用教程HashMap的使用教程HashMap的使用教程22
Aidan075 Aidan075
3年前
讲解Excel的16种图表类型的“含义”,知道该怎么画图了!
大家好,我是小五🐶相同的数据,使用不同的图表进行体现,效果也会千差万别,那么我们应该如何正确选择,才能让图表的作用发挥到极致呢?1.柱形图柱形图是最常见的图表类型,它的适用场合是二维数据集(每个数据点包括两个值,即X和Y),但只有一个维度需要比较的情况。例如,如下图所示的柱形图就表示了一组二维数据,【年份】和【销售额】就是它的两个维度,但只需要比
皕杰报表之柱状图
1.当我们想设置柱状图时,可以在皕杰报表内,鼠标右键设置类型选择图表类型,鼠标双击图表,选择柱状图和图标模式普通柱状图。可以设置为水平方向。2.选择数据设定,在‘分类轴’和‘系列’中分别设定其值或者表达式。3.选择显示格式,一般图表包括图表区,标题与图例,X轴,Y轴和警戒线。图表颜色:设置图表数据区以外的背景色和字体颜色。数据区颜色:设置数据区内的背景颜色和
Stella981 Stella981
2年前
R语言ggplot2画带有空白格的热图简单小例子
!(https://oscimg.oschina.net/oscnet/077fd611a63b411882ae6aec9004cab1.png)image.png之前有人在公众号留言问文章开头这幅图如何实现,下面的B图是折线图加柱形图,相对比较容易实现,上面的A图稍微有点复杂,我想到的办法是拼图,图A可以看成三个热图,然后加一个堆积
Stella981 Stella981
2年前
PHP+echarts 简单人物关系图
开发语言:PHP需求:人物关系图插件echarts 说明:实现功能 复杂功能请自行根据业务逻辑 echarts链接地址如下:http://echarts.baidu.com/echarts2/doc/example/force.html粗略截图:!(https://static.oschina.net/uploads/spac
Stella981 Stella981
2年前
SpringBoot使用@ServerEndpoint无法依赖注入问题解决(WebSocket)
!(https://oscimg.oschina.net/oscnet/up8420801906305684903bceca6a85673cb00.png)!(https://oscimg.oschina.net/oscnet/upf7112141748204868f0368c51f4ea919103.png)如上两图所示,在WebSoc
Wesley13 Wesley13
2年前
IJCAI2020 图相关论文集
↑公众号关注“GraphAI”专注于图机器学习IJCAI2020图相关论文集!(https://oscimg.oschina.net/oscnet/538c1eb7d78b304723ca074c35b6cc896f2.png)
Stella981 Stella981
2年前
ECharts 实现3D嵌套饼图
   嵌套饼图的实现主要是定义多层数据,实际上只需要写成json格式的数组,多层数据源之间用逗号连接起来,自定义样式之后就可以实现,与非嵌套饼图没有很大的区别。1.下载Echarts插件,官网地址:http://echarts.baidu.com/download.html(https://www.oschina.net/action/GoTo
Easter79 Easter79
2年前
SpringBoot使用@ServerEndpoint无法依赖注入问题解决(WebSocket)
!(https://oscimg.oschina.net/oscnet/up8420801906305684903bceca6a85673cb00.png)!(https://oscimg.oschina.net/oscnet/upf7112141748204868f0368c51f4ea919103.png)如上两图所示,在WebSoc
切图网aming 切图网aming
2个月前
优雅轻量级的网页alert弹窗美化插件 alertify.js
alertify.js是一款用于alert美化的插件,支持弹窗,提示,prompt,confirm等多中方式,并且调用简单,非常适合在项目中使用,也是切图网qietu.com在前端切图项目中比较常用的一款js插件,切图网在选择一款js插件的时候一般都要考虑