Distributed tracing is quickly becoming a must-have component in the tools that organizations use to monitor their complex, microservice-based architectures. At Uber Engineering, our open source distributed tracing system Jaeger saw large-scale internal adoption throughout 2016, integrated into hundreds of microservices and now recording thousands of traces every second. As we start the new year, here is the story of how we got here, from investigating off-the-shelf solutions like Zipkin, to why we switched from pull to push architecture, and how distributed tracing will continue to evolve in 2017.
From Monolith to Microservices
As Uber’s business has grown exponentially, so has our software architecture complexity. A little over a year ago, in fall 2015, we had around five hundred microservices. As of early 2017, we have over two thousand. This is in part due to the increasing number of business features—user-facing ones like UberEATS and UberRUSH—as well as internal functions like fraud detection, data mining, and maps processing. The other reason complexity increased was a move away from large monolithic applications to a distributed microservices architecture.
As it often happens, moving into a microservices ecosystem brings its own challenges. Among them is the loss of visibility into the system, and the complex interactions now occurring between services. Engineers at Uber know that our technology has a direct impact on people’s livelihoods. The reliability of the system is paramount, yet it is not possible without observability. Traditional monitoring tools such as metrics and distributed logging still have their place, but they often fail to provide visibility across services. This is where distributed tracing thrives.
Tracing Uber’s Beginnings
The first widely used tracing system at Uber was called Merckx, named after the fastest cyclist in the world during his time. Merckx quickly answered complex queries about Uber’s monolithic Python backend. It made queries like “find me requests where the user was logged in and the request took more than two seconds and only certain databases were used and a transaction was held open for more than 500 ms” possible. The profiling data was organized into a tree of blocks, with each block representing a certain operation or a remote call, similar to the notion of “span” in the OpenTracing API. Users could run ad hoc queries against the data stream in Kafkausing command-line tools. They could also use a web UI to view predefined digests that summarized the high-level behavior of API endpoints and Celery tasks.
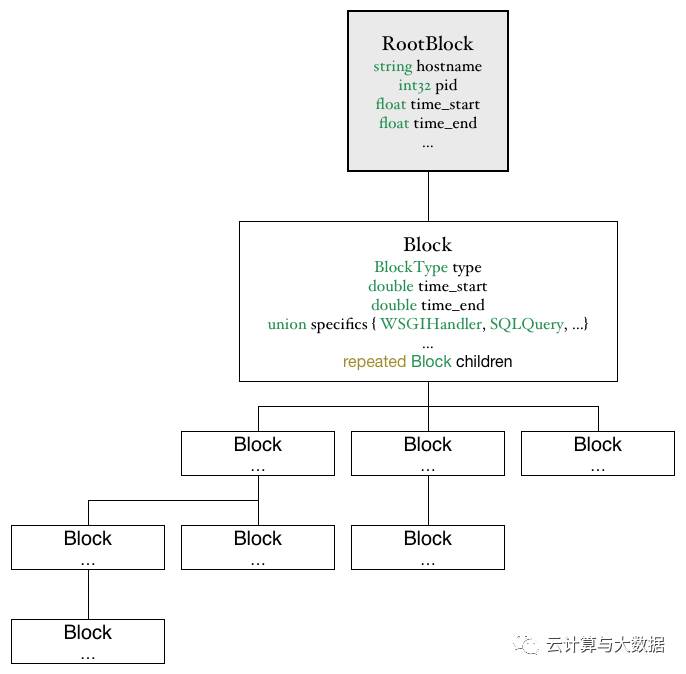
Merckx modeled the call graph as a tree of blocks, with each block representing an operation within the application, such as a database call, an RPC, or even a library function like parsing JSON.
Merckx instrumentation was automatically applied to a number of infrastructure libraries in Python, including HTTP clients and servers, SQL queries, Redis calls, and even JSON serialization. The instrumentation recorded certain performance metrics and metadata about each operation, such as the URL for an HTTP call, or SQL query for database calls. It also captured information like how long database transactions have remained open, and which database shards and replicas were accessed.

Merckx architecture is a pull model from a stream of instrumentation data in Kafka.
The major shortcoming with Merckx was its design for the days of a monolithic API at Uber. Merckx lacked any concept of distributed context propagation. It recorded SQL queries, Redis calls, and even calls to other services, but there was no way to go more than one level deep. One other interesting Merckx limitation was that many advanced features like database transaction tracking really only worked under uWSGI, since Merckx data was stored in a global, thread-local storage. Once Uber started adopting Tornado, an asynchronous application framework for Python services, the thread-local storage was unable to represent many concurrent requests running in the same thread on Tornado’s IOLoop. We began to realize how important it was to have a solid story for keeping request state around and propagating it correctly, without relying on global variables or global state.
Next, Tracing in TChannel
At the beginning of 2015, we started the development of TChannel, a network multiplexing and framing protocol for RPC. One of the design goals of the protocol was to have Dapper-style distributed tracing built into the protocol as a first-class citizen. Toward that goal, the TChannel protocol specification defined tracing fields as part of the binary format.
spanid:8 parentid:8 traceid:8 traceflags:1
field
type
description
spanid
int64
that identifies the current span
parentid
int64
of the previous span
traceid
int64
assigned by the original requestor
traceflags
uint8
bit flags field
Tracing fields appear as part of the binary format in TChannel protocol specification.
In addition to the protocol specification, we released several open-source client libraries that implement the protocol in different languages. One of the design principles for those libraries was to have the notion of a request context that the application was expected to pass through from the server endpoints to the downstream call sites. For example, in tchannel-go, the signature to make an outbound call with JSON encoding required the context as the first argument:
func (c *Client) Call(ctx Context, method string, arg, resp interface{}) error {..}
The TChannel libraries encouraged application developers to write their code with distributed context propagation in mind.
The client libraries had built-in support for distributed tracing by marshalling the tracing context between the wire representation and the in-memory context object, and by creating tracing spans around service handlers and the outbound calls. Internally, the spans were represented in a format nearly identical to the Zipkin tracing system, including the use of Zipkin-specific annotations, such as “cs” (Client Send) and “cr” (Client Receive). TChannel used a tracing reporter interface to send the collected tracing spans out of process to the tracing system’s backend. The libraries came with a default reporter implementation that used TChannel itself and Hyperbahn, the discovery and routing layer, to send the spans in Thrift format to a cluster of collectors.
TChannel client libraries got us close to the working distributing tracing system Uber needed, providing the following building blocks:
Interprocess propagation of tracing context, in-band with the requests
Instrumentation API to record tracing spans
In-process propagation of the tracing context
Format and mechanism for reporting tracing data out of process to the tracing backend
The only missing piece was the tracing backend itself. Both the wire format of the tracing context and the default Thrift format used by the reporter have been designed to make it very straightforward to integrate TChannel with a Zipkin backend. However, at the time the only way to send spans to Zipkin was via Scribe, and the only performant data store that Zipkin supported was Cassandra. Back then, we had no direct operational experience for either of those technologies, so we built a prototype backend that combined some custom components with the Zipkin UI to form a complete tracing system.
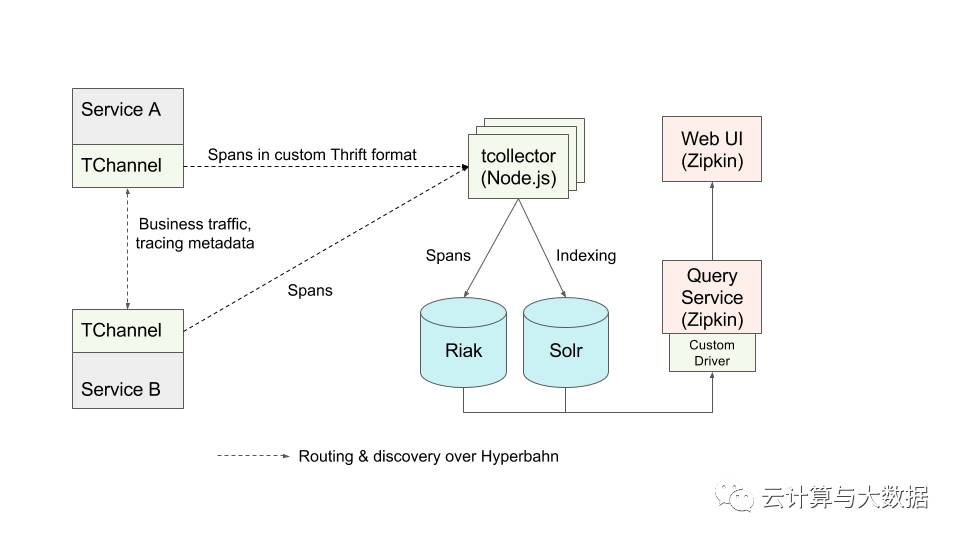
The architecture of the prototype backend for TChannel-generated traces was a push model with custom collectors, custom storage, and the open source Zipkin UI.
The success of distributed tracing systems at other major tech companies such as Google and Twitter was predicated on the availability of RPC frameworks, Stubby and Finagle respectively, widely used at those companies.
Similarly, out-of-the-box tracing capabilities in TChannel were a big step forward. The deployed backend prototype started receiving traces from several dozen services right away. More services were being built using TChannel, but full-scale production rollout and widespread adoption were still problematic. The prototype backend and its Riak/Solr based storage had some issues scaling up to Uber’s traffic, and several query capabilities were missing to properly interoperate with the Zipkin UI. And despite the rapid adoption of TChannel by new services, Uber still had a large number of services not using TChannel for RPC; in fact, most of the services responsible for running the core business functions ran without TChannel. These services were implemented in four major programming languages (Node.js, Python, Go, and Java), using a variety of different frameworks for interprocess communication. This heterogeneity of the technology landscape made deploying distributed tracing at Uber a much more difficult task than at places like Google and Twitter.
Building Jaeger in New York City
The Uber NYC Engineering organization began in early 2015, with two primary teams: Observability on the infrastructure side and Uber Everything on the product side (including UberEATS and UberRUSH). Since distributed tracing is a form of production monitoring, it was a good fit for Observability.
We formed the Distributed Tracing team with two engineers and two objectives: transform the existing prototype into a full-scale production system, and make distributed tracing available to and adopted by all Uber microservices. We also needed a code name for the project. Naming things is one of the two hard problems in computer science, so it took us a couple weeks of brainstorming words with the themes of tracing, detectives, and hunting, until we settled on the name Jaeger (ˈyā-gər), German for hunter or hunting attendant.
The NYC team already had the operational experience of running Cassandra clusters, which was the database directly supported by the Zipkin backend, so we decided to abandon the Riak/Solr based prototype. We reimplemented the collectors in Go to accept TChannel traffic and store it in Cassandra in the binary format compatible with Zipkin. This allowed us to use Zipkin web and query services without any modifications, and also provided the missing functionality of searching traces by custom tags. We have also built in a dynamically configurable multiplication factor into each collector to multiply the inbound traffic n times for the purpose of stress testing the backend with production data.
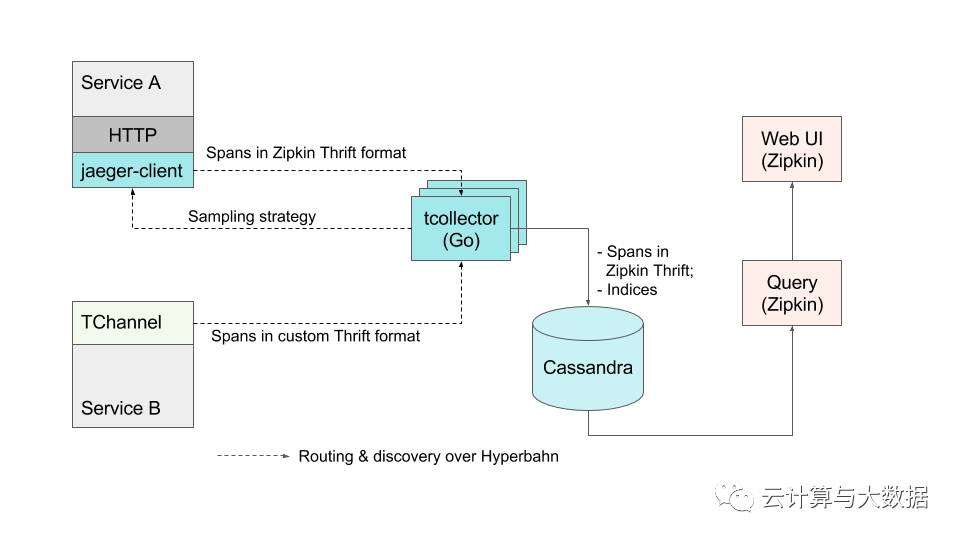
The early Jaeger architecture still relied on Zipkin UI and Zipkin storage format.
The second order of business was to make tracing available to all the existing services that were not using TChannel for RPC. We spent the next few months building client side libraries in Go, Java, Python, and Node.js to support instrumentation of arbitrary services, including HTTP-based ones. Even though the Zipkin backend was fairly well known and popular, it lacked a good story on the instrumentation side, especially outside of the Java/Scala ecosystem. We considered various open source instrumentation libraries, but they were maintained by different people with no guarantee of interoperability on the wire, often with completely different APIs, and most requiring Scribe or Kafka as the transport for reporting spans. We ultimately decided to write our own libraries that would be integration tested for interoperability, support the transport that we needed, and, most importantly, provide a consistent instrumentation API in different languages. All our client libraries have been build to support the OpenTracing API from inception.
Another novel feature that we built into the very first versions of the client libraries was the ability to poll the tracing backend for the sampling strategy. When a service receives a request that has no tracing metadata, the tracing instrumentation usually starts a new trace for that request by generating a new random trace ID. However, most production tracing systems, especially those that have to deal with the scale of Uber, do not profile every single trace or record it in storage. Doing so would create a prohibitively large volume of traffic from the services to the tracing backend, possibly orders of magnitude larger than the actual business traffic handled by the services. Instead, most tracing systems sample only a small percentage of traces and only profile and record those sampled traces. The exact algorithm for making a sampling decision is what we call a sampling strategy. Examples of sampling strategies include:
Sample everything. This is useful for testing, but expensive in production!
A probabilistic approach, where a given trace is sampled randomly with a certain fixed probability.
A rate limiting approach, where X number of traces are sampled per time unit. For example, a variant of the leaky bucket algorithm might be used.
Most existing Zipkin-compatible instrumentation libraries support probabilistic sampling, but they expect the sampling rate to be configured on initialization. Such an approach leads to several serious problems when used at scale:
A given service has little insight about the impact of the sampling rate on the overall traffic to the tracing backend. For example, even if the service itself has a moderate Query Per Second (QPS) rate, it could be calling another downstream service that has a very high fanout factor or using extensive instrumentation that results in a lot of tracing spans.
At Uber, business traffic exhibits strong daily seasonality; more people take rides during peak hours. A fixed sampling probability might be too low for off-peak traffic, yet too high for peak traffic.
The polling feature in Jaeger client libraries was designed to address these problems. By moving the decision about the appropriate sampling strategy to the tracing backend, we free service developers from guessing about the appropriate sampling rate. This also allows the backend to dynamically adjust the sampling rates as the traffic patterns change. The diagram below shows the feedback loop from collectors to the client libraries.
The first versions of the client libraries still used TChannel to send tracing spans out of process by submitting them directly to collectors, so the libraries depended on Hyperbahn for discovery and routing. This dependency created unnecessary friction for engineers adopting tracing for their services, both on the infrastructure level and on the number of extra libraries they had to pull into the service, potentially creating dependency hell.
We addressed that by implementing the jaeger-agent sidecar process, deployed to all hosts as an infrastructure component just like the agents collecting metrics. All routing and discovery dependencies were encapsulated in the jaeger-agent, and we redesigned the client libraries to report tracing spans to a local UDP port and poll the agent on the loopback interface for the sampling strategies. Only the basic networking libraries are required by the new clients. This architectural change was a step toward our vision of using post-trace sampling: buffering traces in memory in the agents.
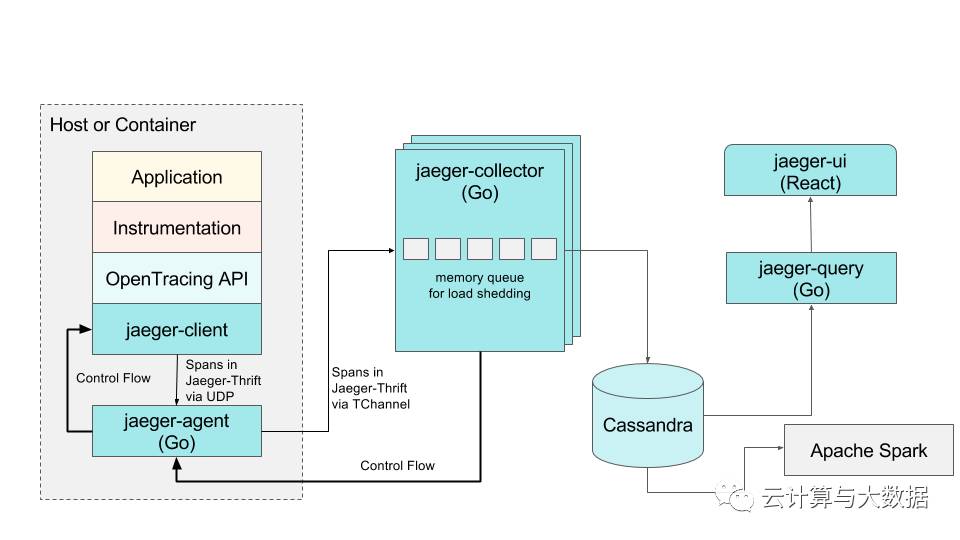
The current Jaeger architecture: backend components implemented in Go, client libraries in four languages supporting OpenTracing standard, a React-based web front-end, and a post-processing and aggregation data pipeline based on Apache Spark.
Turnkey Distributed Tracing
The Zipkin UI was the last piece of third-party software we had in Jaeger. Having to store spans in Cassandra in Zipkin Thrift format for compatibility with the UI limited our backend and data model. In particular, the Zipkin model did not support two important features available in the OpenTracing standard and our client libraries: a key-value logging API and traces represented as more general directed acyclic graphs rather than just trees of spans. We decided to take the plunge, renovate the data model in our backend, and write a new UI. Shown below, the new data model natively supports both key-value logging and span references. It also optimizes the volume of data sent out of process by avoiding process tag duplication in every span:
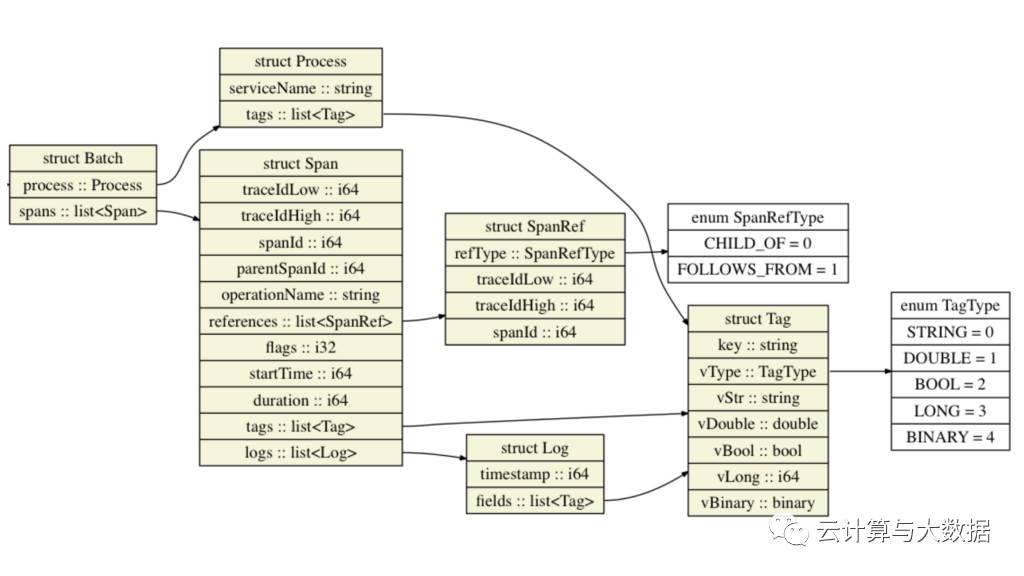
The Jaeger data model natively supports both key-value logging and span references.
We are currently completing the upgrade of the backend pipeline to the new data model and a new, better optimized Cassandra schema. To take advantage of the new data model, we have implemented a new Jaeger-query service in Go and a brand new web UI built with React. The initial version of the UI mostly reproduces existing features of the Zipkin UI, but it was architected to be easily extensible with new features and components as well as embeddable into other UIs as a React component itself. For example, a user can select a number of different views to visualize trace results, such as a histogram of trace durations or the service’s cumulative time in the trace:

The Jaeger UI shows trace search results. In the top right corner, a duration vs. time scatter plot gives a visual representation of the results and drill-down capability.
As another example, a single trace can be viewed according to specific use cases. The default rendering is a time sequence; other views include a directed acyclic graph or a critical path diagram:
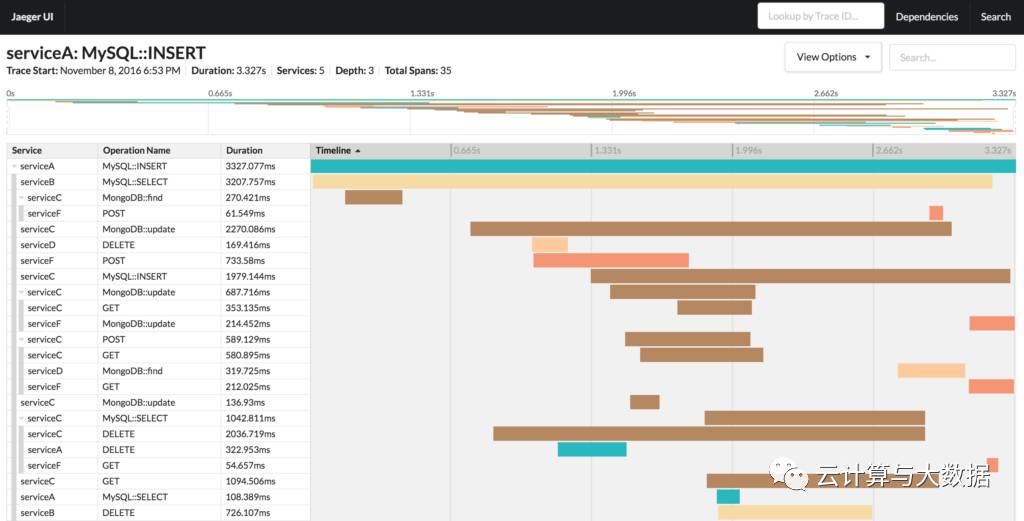
The Jaeger UI shows a single trace’s details. At the top of the screen is a minimap diagram of the trace that supports easier navigation within large traces.
By replacing the remaining Zipkin components in our architecture with Jaeger’s own components, we position Jaeger to be a turnkey, end-to-end distributed tracing system.
We believe it is crucial that the instrumentation libraries be inherently part of Jaeger, to guarantee both their compatibility with the Jaeger backend and interoperability amongst themselves via continuous integration testing. (This guarantee was unavailable in the Zipkin ecosystem.) In particular, the interoperability across all supported languages (currently Go, Java, Python, and Node.js) and all supported wire transports (currently HTTP and TChannel) is tested as part of every pull request with the help of the crossdock framework, written by the Uber Engineering RPC team. You can find the details of the Jaeger client integration tests in the jaeger-client-go crossdock repository. At the moment, all Jaeger client libraries are available as open source:
Go
Java
Node.js
Python
We are migrating the backend and the UI code to Github, and plan to have the full Jaeger source code available soon. If you are interested in the progress, watch the main repository. We welcome contributions, and would love to see others give Jaeger a try. While we are pleased with the progress so far, the story of distributed tracing at Uber is still far from finished.
Yuri Shkuro is a staff software engineer in the Uber New York City engineering office, and is in all likelihood diligently working on Jaeger and other Uber Engineering open source contributions__right now.
Editor Update April 15, 2017: Jaeger is now officially open source, with resulting documentation.
本文分享自微信公众号 - 云服务圈(heidcloud)。
如有侵权,请联系 support@oschina.cn 删除。
本文参与“OSC源创计划”,欢迎正在阅读的你也加入,一起分享。


