使用python的科学计算库,达到快速计算的效果。
标准的Python中用列表(list)保存一组值,可以当作数组使用。但由于列表的元素可以是任何对象,因此列表中保存的是对象的指针。这样一来,为了保存一个简单的列表[1,2,3],就需
要有三个指针和三个整数对象。对于数值运算来说,这种结构显然比较浪费内存和 CPU 计算时间。
使用numpy的array模块可以解决这个问题。细节不在此赘述。这里主要记录一些matplotlib的基本使用方法
- first plot
#first plot with matplotlib
import matplotlib.pyplot as plt
plt.plot([1,3,2,4])
plt.show()
in order to avoid pollution of global namespace, it is strongly recommended to never import like:
from
- simple plot
import matplotlib as mpl
import matplotlib.pyplot as plt
import numpy as np
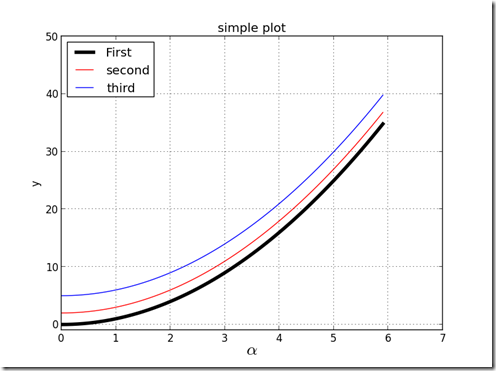
x = np.arange(0.0,6.0,0.1)
plt.plot(x, [xi**2 for xi in x],label = 'First',linewidth = 4,color = 'black')
plt.plot(x, [xi**2+2 for xi in x],label = 'second',color = 'red')
plt.plot(x, [xi**2+5 for xi in x],label = 'third')
plt.axis([0,7,-1,50])
plt.xlabel(r"$\alpha$",fontsize=20)
plt.ylabel(r'y')
plt.title('simple plot')
plt.legend(loc = 'upper left')
plt.grid(True)
plt.savefig('simple plot.pdf',dpi = 200)
print mpl.rcParams['figure.figsize'] #return 8.0,6.0
print mpl.rcParams['savefig.dpi'] #default to 100 the size of the pic will be 800*600
#print mpl.rcParams['interactive']
plt.show()
- Decorate plot with styles and types
import matplotlib as mpl
import matplotlib.pyplot as plt
import numpy as np
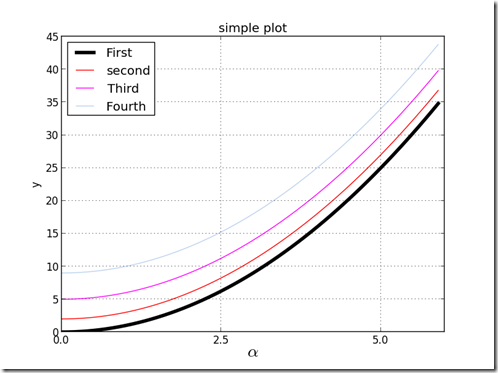
x = np.arange(0.0,6.0,0.1)
plt.plot(x, [xi**2 for xi in x],label = 'First',linewidth = 4,color = 'black') #using color string to specify color
plt.plot(x, [xi**2+2 for xi in x],'r',label = 'second') #using abbreviation to specify color
plt.plot(x, [xi**2+5 for xi in x],color = (1,0,1,1),label = 'Third') #using color tuple to specify color
plt.plot(x, [xi**2+9 for xi in x],color = '#BCD2EE',label = 'Fourth') #using hex string to specify color
plt.xticks(np.arange(0.0,6.0,2.5))
plt.xlabel(r"$\alpha$",fontsize=20)
plt.ylabel(r'y')
plt.title('simple plot')
plt.legend(loc = 'upper left')
plt.grid(True)
plt.savefig('simple plot.pdf',dpi = 200)
print mpl.rcParams['figure.figsize'] #return 8.0,6.0
print mpl.rcParams['savefig.dpi'] #default to 100 the size of the pic will be 800*600
#print mpl.rcParams['interactive']
plt.show()
- types of graph
- Bars
import matplotlib.pyplot as plt
import numpy as np
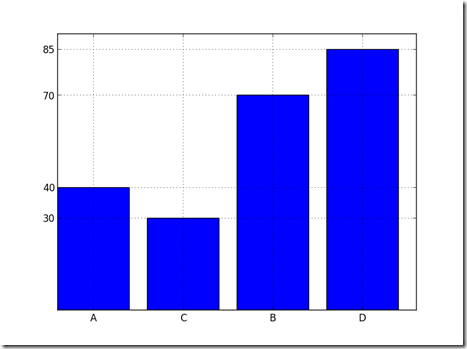
dict = {'A': 40, 'B': 70, 'C': 30, 'D': 85}
for i, key in enumerate(dict): plt.bar(i, dict[key]);
plt.xticks(np.arange(len(dict))+0.4, dict.keys());
plt.yticks(dict.values());
plt.grid(True)
plt.show()
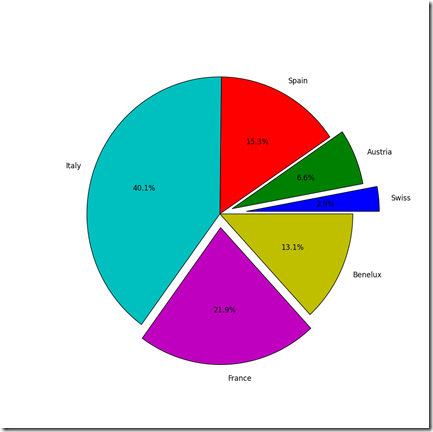
- Pies
import matplotlib.pyplot as plt
plt.figure(figsize=(10,10));
x = [4, 9, 21, 55, 30, 18]
labels = ['Swiss', 'Austria', 'Spain', 'Italy', 'France',
'Benelux']
explode = [0.2, 0.1, 0, 0, 0.1, 0]
plt.pie(x, labels=labels, explode=explode, autopct='%1.1f%%');
plt.show()
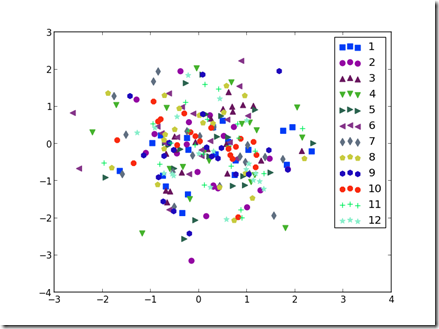
- Scatter
import matplotlib.pyplot as plt
import numpy as np
x = np.random.randn(12,20)
y = np.random.randn(12,20)
mark = ['s','o','^','v','>','<','d','p','h','8','+','*']
for i in range(0,12):
plt.scatter(x[i],y[i],marker = mark[i],color =(np.random.rand(1,3)),s=50,label = str(i+1))
plt.legend()
plt.show()


