更新: 2019/03 无意间发现Graphic上已有 LinearGradient属性 🎉🎉🎉
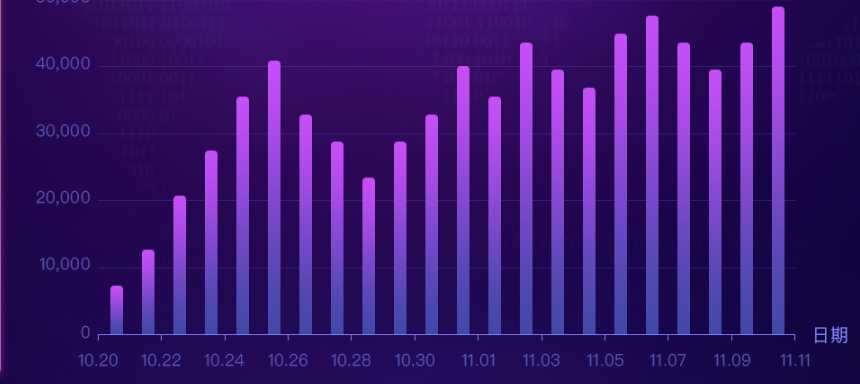
效果如图: 是不是比较炫~
遇到的问题:@types/echart 到目前只到 v4.1.1,类型“Graphic”上没有 LinearGradient属性
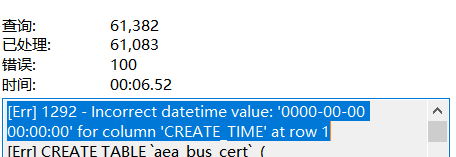
tslint提示:color: new echarts.graphic中没有LinearGradient属性
, ,,, 不支持那渐变还怎么显示出来呢,无奈,只有搬出
“
// @ts-ignore
”
让它跳过类型检查啦,真的希望echarts团队赶紧把这个属性定义一下,总感觉这么暴力的方式不优雅哈哈~
// 1. 引入模块

import ReactEcharts from 'echarts-for-react'

import * as echarts from 'echarts'

// 2. 配置  get option() {

    const dataAxis = ['10,20', '10.21', '10.22']
    const chartsCost = [100, 200, 300]
    return {
      dataZoom: [
        {
          type: 'inside',
        },
      ],
      grid: {},
      series: [
        {
          animation: false,
          barCategoryGap: '40%',
          barGap: '-100%',
          data: dataAxis,
          itemStyle: {
            normal: { color: '#000' },
          },
          type: 'bar',
        },
        {
          data: chartsCost,
          itemStyle: {
            emphasis: {
              barBorderRadius: 20,
              // @ts-ignore
              color: new echarts.graphic.LinearGradient(0, 0, 0, 1, [
                { offset: 0, color: 'rgba(215,59,255,1)' },
                { offset: 0.5, color: 'rgba(66,70,175,1)' },
              ]),
            },
            normal: {
              barBorderRadius: [3, 3, 0, 0],
              // @ts-ignore
              color: new echarts.graphic.LinearGradient(0, 0, 0, 1, [
                { offset: 0, color: 'rgba(215,59,255,1)' },
                { offset: 0.6, color: 'rgba(66,70,175,1)' },
              ]),
            },
          },
          type: 'bar',
        },
      ],
      xAxis: {
        axisLabel: {
          textStyle: {
            color: 'rgba(136,58,253,1)',
          },
        },

        axisLine: {
          show: true,
        },
        axisTick: {
          show: true,
        },
        data: dataAxis,
        name: '日期',
        nameTextStyle: {
          color: 'rgba(136,58,253,1)',
        },
        z: 10,
      },
      yAxis: {
        axisLabel: {
          textStyle: {
            color: 'rgba(136,58,253,1)',
          },
        },
        axisLine: {
          show: false,
        },
        axisTick: {
          show: false,
        },
        name: '投放额',
        nameTextStyle: {
          color: 'rgba(136,58,253,1)',
        },
        splitLine: {
          lineStyle: {
            color: 'rgba(136,58,253,.2)',
          },
          show: true,
        },
      },
    }
  }


// 3. 调用echarts-for-react
        <ReactEcharts
            option={this.option}
            notMerge={true}
            lazyUpdate={true}
            style={{ height: '100%' }}
        />


