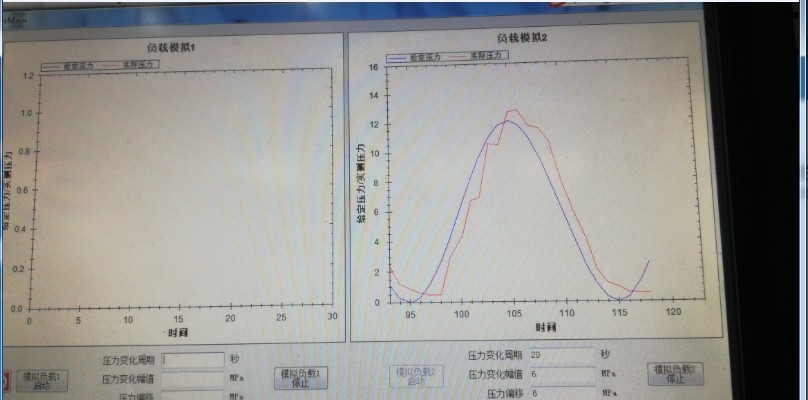
上位机程序控制PLC模拟量通道输出周期性正弦波信号,并采集所造成改变的模拟量输入信号,并绘制数据变化曲线。
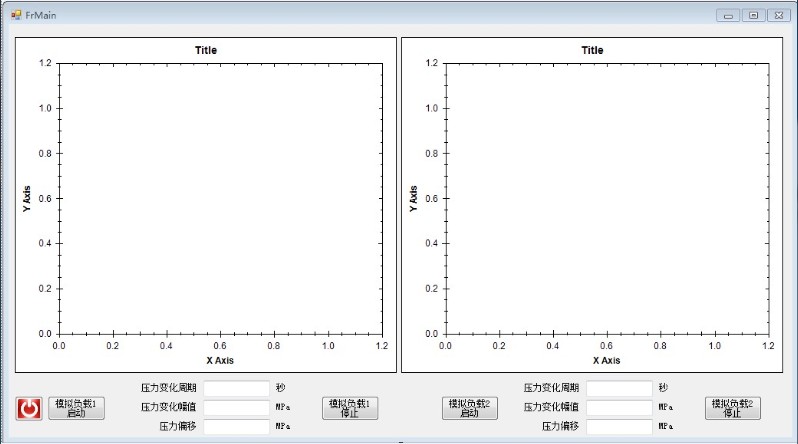
界面如图:

最后测试效果如图:

代码:
using System;
using System.Collections.Generic;
using System.ComponentModel;
using System.Data;
using System.Drawing;
using System.Linq;
using System.Text;
using System.Threading.Tasks;
using System.Windows.Forms;
using ZedGraph;

namespace ProfessionalTest
{
    public partial class FrMain : Form
    {
        #region 构造函数
        int tickStart = 0;
        int tickStart2 = 0;
        int zQ1 = 0;
        int zQ2 = 0;
        int fZ1 = 0;
        int fZ2 = 0;
        int pY1 = 0;
        int pY2 = 0;
        public FrMain()
        {
            InitializeComponent();
            this.ControlBox = false;
        }
        #endregion
        /// <summary>
        /// 窗体加载对两个表进行初始化
        /// </summary>
        /// <param name="sender"></param>
        /// <param name="e"></param>
        private void FrMain_Load(object sender, EventArgs e)
        {
            //无需油源流量压力设置,油源手动控制
            //OPC.OpcServer server = OPC.OpcServer.GetServer();  ///一个PC ACCESS 即为一个OPC server
            //server["油源"]["专业台当前流量"] = (float)50;
            //server["油源"]["专业台当前压力"] = (float)10;
            #region 负载模拟1
            //获取引用
            GraphPane myPane = zedGraphControl1.GraphPane;
            //设置标题
            myPane.Title.Text = "负载模拟1";
            //设置X轴说明文字
            myPane.XAxis.Title.Text = "时间";
            //设置Y轴说明文字
            myPane.YAxis.Title.Text = "给定压力/实测压力";

            //设置1200个点,假设每50毫秒更新一次,刚好检测1分钟,一旦构造后将不能更改这个值
            RollingPointPairList list = new RollingPointPairList(1200);
            RollingPointPairList list2 = new RollingPointPairList(1200);
            //开始,增加的线是没有数据点的(也就是list为空)
            //增加一条名称:Voltage,颜色Color.Bule,无符号,无数据的空线条
            LineItem curve = myPane.AddCurve("给定压力", list, Color.Blue, SymbolType.None);
            LineItem curve2 = myPane.AddCurve("实际压力", list2, Color.Red, SymbolType.None);
            timerDraw.Interval = 1000; //设置timer控件的间隔为500毫秒
            timerDraw.Enabled = true; //timer可用
            timerDraw.Stop(); //开始

            myPane.XAxis.Scale.Min = 0; //X轴最小值0
            myPane.XAxis.Scale.Max = 30; //X轴最大30
            myPane.XAxis.Scale.MinorStep = 1;//X轴小步长1,也就是小间隔
            myPane.XAxis.Scale.MajorStep = 5;//X轴大步长为5,也就是显示文字的大间隔

            //改变轴的刻度
            zedGraphControl1.AxisChange();

            //保存开始时间
            //tickStart = Environment.TickCount;
            #endregion
            #region 负载模拟2
            //获取引用
            GraphPane myPane1 = zedGraphControl2.GraphPane;
            //设置标题
            myPane1.Title.Text = "负载模拟2";
            //设置X轴说明文字
            myPane1.XAxis.Title.Text = "时间";
            //设置Y轴说明文字
            myPane1.YAxis.Title.Text = "给定压力/实测压力";

            //设置1200个点,假设每50毫秒更新一次,刚好检测1分钟,一旦构造后将不能更改这个值
            RollingPointPairList list3 = new RollingPointPairList(1200);
            RollingPointPairList list4 = new RollingPointPairList(1200);
            //开始,增加的线是没有数据点的(也就是list为空)
            //增加一条名称:Voltage,颜色Color.Bule,无符号,无数据的空线条
            LineItem curve3 = myPane1.AddCurve("给定压力", list3, Color.Blue, SymbolType.None);
            LineItem curve4 = myPane1.AddCurve("实际压力", list4, Color.Red, SymbolType.None);

            timer1Draw.Interval = 1000; //设置timer控件的间隔为500毫秒
            timer1Draw.Enabled = true; //timer可用
            timer1Draw.Stop(); //暂不启动

            myPane1.XAxis.Scale.Min = 0; //X轴最小值0
            myPane1.XAxis.Scale.Max = 30; //X轴最大30
            myPane1.XAxis.Scale.MinorStep = 1;//X轴小步长1,也就是小间隔
            myPane1.XAxis.Scale.MajorStep = 5;//X轴大步长为5,也就是显示文字的大间隔

            //改变轴的刻度
            zedGraphControl2.AxisChange();

            //保存开始时间
            //tickStart2 = Environment.TickCount;
            #endregion
        }
        /// <summary>
        /// 负载1模拟开始
        /// </summary>
        /// <param name="sender"></param>
        /// <param name="e"></param>
        private void button1_Click(object sender, EventArgs e)
        {
            try
            {
                zQ1 = int.Parse(textBox1.Text);
                fZ1 = int.Parse(textBox2.Text);
                pY1 = int.Parse(textBox5.Text);
                if (zQ1<=10)
                {
                    MessageBox.Show("周期过小,请将周期设为10秒以上") ;
                    return;
                }
                if (fZ1<=5)
                {
                    MessageBox.Show("幅值过小,请将幅值设为5MPa以上");
                    return;
                }
                else if (fZ1>=15)
                {
                    MessageBox.Show("幅值过大,请将幅值设为15MPa以下");
                    return;
                }
                if (pY1-fZ1 <0)
                {
                    MessageBox.Show("压力过小,请将压力设为0MPa以上");
                    return;
                }
                else if (fZ1 +pY1> 31.5)
                {
                    MessageBox.Show("压力过大,请将压力设为15MPa以下");
                    return;
                }
                button1.Enabled = false;
                timerDraw.Start();
                //保存开始时间
                tickStart = Environment.TickCount;
                #region 清空原有图表
                //确保CurveList不为空
                if (zedGraphControl1.GraphPane.CurveList.Count <= 0)
                {
                    return;
                }

                //取Graph第一个曲线,也就是第一步:在GraphPane.CurveList集合中查找CurveItem
                LineItem curve = zedGraphControl1.GraphPane.CurveList[0] as LineItem;
                LineItem curve2 = zedGraphControl1.GraphPane.CurveList[1] as LineItem;
                if (curve == null | curve2 == null)
                {
                    return;
                }
                //第二步:在CurveItem中访问PointPairList(或者其它的IPointList),根据自己的需要增加新数据或修改已存在的数据
                IPointListEdit list = curve.Points as IPointListEdit;
                IPointListEdit list2 = curve2.Points as IPointListEdit;
                list.Clear();
                list2.Clear();
                //第三步:调用Form.Invalidate()方法更新图表
                zedGraphControl1.Invalidate();
#endregion
            }
            catch (Exception)
            {
                MessageBox.Show("请输入正确数值");
            }
        }
        /// <summary>
        /// 负载2模拟开始
        /// </summary>
        /// <param name="sender"></param>
        /// <param name="e"></param>
        private void button2_Click(object sender, EventArgs e)
        {
            try
            {
                zQ2 = int.Parse(textBox3.Text);
                fZ2 = int.Parse(textBox4.Text);
                pY2 = int.Parse(textBox6.Text);
                if (zQ2 <= 10)
                {
                    MessageBox.Show("周期过小,请将周期设为10秒以上");
                    return;
                }
                if (fZ2 <= 5)
                {
                    MessageBox.Show("幅值过小,请将幅值设为5MPa以上");
                    return;
                }
                else if (fZ2 >= 15)
                {
                    MessageBox.Show("幅值过大,请将幅值设为15MPa以下");
                    return;
                }
                if (pY2 - fZ2 < 0)
                {
                    MessageBox.Show("压力过小,请将压力设为0MPa以上");
                    return;
                }
                else if (fZ2 + pY2 > 31.5)
                {
                    MessageBox.Show("压力过大,请将压力设为15MPa以下");
                    return;
                }
                button2.Enabled = false;
                timer1Draw.Start();
                //保存开始时间
                tickStart2 = Environment.TickCount;
                #region 清空原有图表
                //确保CurveList不为空
                if (zedGraphControl2.GraphPane.CurveList.Count <= 0)
                {
                    return;
                }

                //取Graph第一个曲线,也就是第一步:在GraphPane.CurveList集合中查找CurveItem
                LineItem curve3 = zedGraphControl2.GraphPane.CurveList[0] as LineItem;
                LineItem curve4 = zedGraphControl2.GraphPane.CurveList[1] as LineItem;
                if (curve3 == null | curve4 == null)
                {
                    return;
                }
                //第二步:在CurveItem中访问PointPairList(或者其它的IPointList),根据自己的需要增加新数据或修改已存在的数据
                IPointListEdit list3 = curve3.Points as IPointListEdit;
                IPointListEdit list4 = curve4.Points as IPointListEdit;
                if (list3 == null | list4 == null)
                {
                    return;
                }
                list3.Clear();
                list4.Clear();
                //第三步:调用Form.Invalidate()方法更新图表
                zedGraphControl2.Invalidate();
                #endregion

            }
            catch (Exception)
            {
                MessageBox.Show("请输入正确数值");
            }
        }
        /// <summary>
        /// 负载1模拟停止
        /// </summary>
        /// <param name="sender"></param>
        /// <param name="e"></param>
        private void button3_Click(object sender, EventArgs e)
        {
            timerDraw.Enabled = false;
            timerDraw.Stop();
            button1.Enabled = true;
            OPC.OpcServer server = OPC.OpcServer.GetServer();
            server["专业试验台"]["比例溢流阀4_1模拟缓存"] = (float)0;//写入压力0
        }
        /// <summary>
        /// 负载2模拟停止
        /// </summary>
        /// <param name="sender"></param>
        /// <param name="e"></param>
        private void button4_Click(object sender, EventArgs e)
        {
            timer1Draw.Enabled = false;
            timer1Draw.Stop();
            button2.Enabled = true;
            OPC.OpcServer server = OPC.OpcServer.GetServer();
            server["专业试验台"]["比例溢流阀4_2模拟缓存"] = (float)0;//写入压力0
        }
        /// <summary>
        /// 负载模拟1表格定时更新
        /// </summary>
        /// <param name="sender"></param>
        /// <param name="e"></param>
        private void timerDraw_Tick(object sender, EventArgs e)
        {
            //确保CurveList不为空
            if (zedGraphControl1.GraphPane.CurveList.Count <= 0)
            {
                return;
            }

            //取Graph第一个曲线,也就是第一步:在GraphPane.CurveList集合中查找CurveItem
            LineItem curve = zedGraphControl1.GraphPane.CurveList[0] as LineItem;
            LineItem curve2 = zedGraphControl1.GraphPane.CurveList[1] as LineItem;
            if (curve == null | curve2 == null)
            {
                return;
            }
            //第二步:在CurveItem中访问PointPairList(或者其它的IPointList),根据自己的需要增加新数据或修改已存在的数据
            IPointListEdit list = curve.Points as IPointListEdit;
            IPointListEdit list2 = curve2.Points as IPointListEdit;
            if (list == null | list2 == null)
            {
                return;
            }
            // 时间用秒表示
            double time = (Environment.TickCount - tickStart) / 1000.0;
            // 周期为zQ1,幅值为fZ1
            OPC.OpcServer server = OPC.OpcServer.GetServer();
            float gDYL = (float)(fZ1 * Math.Sin(2.0 * Math.PI * time / zQ1))+pY1;//给定压力值
            float sJYL = server["专业试验台"]["负载模拟压力缓存1_1"];//实际读取压力值
            server["专业试验台"]["比例溢流阀4_1模拟缓存"] = gDYL;//将周期值写入PLC
            list.Add(time, (double)gDYL);
            list2.Add(time, (double)sJYL);
            Console.WriteLine(time.ToString());
            Scale xScale = zedGraphControl1.GraphPane.XAxis.Scale;
            if (time > xScale.Max - xScale.MajorStep)
            {
                xScale.Max = time + xScale.MajorStep;
                xScale.Min = xScale.Max - 30.0;
            }

            //第三步:调用ZedGraphControl.AxisChange()方法更新X和Y轴的范围
            zedGraphControl1.AxisChange();

            //第四步:调用Form.Invalidate()方法更新图表
            zedGraphControl1.Invalidate();
        }
        /// <summary>
        /// 负载模拟2表格定时更新
        /// </summary>
        /// <param name="sender"></param>
        /// <param name="e"></param>
        private void timer1Draw_Tick(object sender, EventArgs e)
        {
            //确保CurveList不为空
            if (zedGraphControl2.GraphPane.CurveList.Count <= 0)
            {
                return;
            }

            //取Graph第一个曲线,也就是第一步:在GraphPane.CurveList集合中查找CurveItem
            LineItem curve3 = zedGraphControl2.GraphPane.CurveList[0] as LineItem;
            LineItem curve4 = zedGraphControl2.GraphPane.CurveList[1] as LineItem;
            if (curve3 == null | curve4 == null)
            {
                return;
            }
            //第二步:在CurveItem中访问PointPairList(或者其它的IPointList),根据自己的需要增加新数据或修改已存在的数据
            IPointListEdit list3 = curve3.Points as IPointListEdit;
            IPointListEdit list4 = curve4.Points as IPointListEdit;
            if (list3 == null | list4 == null)
            {
                return;
            }
            // 时间用秒表示
            double time = (Environment.TickCount - tickStart2) / 1000.0;
            // 周期为zQ2,幅值为fZ2
            OPC.OpcServer server = OPC.OpcServer.GetServer();
            float gDYL = (float)(fZ2 * Math.Sin(2.0 * Math.PI * time / zQ2))+pY2;//给定压力值
            float sJYL = server["专业试验台"]["负载模拟压力缓存1_2"];//实际读取压力值
            server["专业试验台"]["比例溢流阀4_2模拟缓存"] = gDYL;//将周期值写入PLC
            list3.Add(time, gDYL);
            list4.Add(time, sJYL);
            Console.WriteLine(time.ToString());
            Scale xScale = zedGraphControl2.GraphPane.XAxis.Scale;
            if (time > xScale.Max - xScale.MajorStep)
            {
                xScale.Max = time + xScale.MajorStep;
                xScale.Min = xScale.Max - 30.0;
            }

            //第三步:调用ZedGraphControl.AxisChange()方法更新X和Y轴的范围
            zedGraphControl2.AxisChange();

            //第四步:调用Form.Invalidate()方法更新图表
            zedGraphControl2.Invalidate();
        }
        /// <summary>
        /// 关闭窗体
        /// </summary>
        /// <param name="sender"></param>
        /// <param name="e"></param>
        private void button5_Click(object sender, EventArgs e)
        {
            OPC.OpcServer server = OPC.OpcServer.GetServer();
            server["专业试验台"]["比例溢流阀4_1模拟缓存"] = (float)0;//写入压力0
            server["专业试验台"]["比例溢流阀4_2模拟缓存"] = (float)0;//写入压力0
            this.Close();
        }
    }
}


