导读
作者: Vadim Tkachenko
原文:
https://www.percona.com/blog/2018/04/30/a-look-at-myrocks-performance/
翻译:菜鸟盟( hades、bruce、冰焰)
本文建议横屏阅读,效果更佳
In this blog post, I’ll look at MyRocks performance through some benchmark testing.
在这篇博客里,我将会通过一些基准测试研究一下MyRocks的性能。
As the MyRocks storage engine (based on the RocksDB key-value store http://rocksdb.org ) is now available as part of Percona Server for MySQL 5.7, I wanted to take a look at how it performs on a relatively high-end server and SSD storage. I wanted to check how it performs for different amounts of available memory for the given database size. This is similar to the benchmark I published a while ago for InnoDB (https://www.percona.com/blog/2010/04/08/fast-ssd-or-more-memory/).
MyRocks存储引擎(基于RocksDB键值存储 http://rocksdb.org )现在作为Percona MySQL 5.7分支的一部分,我想研究一下它在相对高端的服务器和SSD存储上的性能。在内存不同大小的服务器上的性能情况,和我之前发布的的Innodb基准测试类似(https://www.percona.com/blog/2010/04/08/fast-ssd-or-more-memory/).
In this case, I plan to use a sysbench-tpcc benchmark (https://www.percona.com/blog/2018/03/05/tpcc-like-workload-sysbench-1-0/) and I will execute it for both MyRocks and InnoDB. We’ll use InnoDB as a baseline.
在这个例子里,我计划用sysbench-tpcc benchmark(下载地址 https://www.percona.com/blog/2018/03/05/tpcc-like-workload-sysbench-1-0/) 测试MyRocks和InnoDB,用InnoDB作为基准指标。
For the benchmark, I will use 100 TPC-C warehouses, with a set of 10 tables (to shift the bottleneck from row contention). This should give roughly 90GB of data size (when loaded into InnoDB) and is a roughly equivalent to 1000 warehouses data size.
测试将会用100 TPC-C warehouses和10个表(为了避免行争用的瓶颈)。这将提供大约90GB数据量(InnoDB大小),大约相当于1000个warehouses数据大小。
To vary the memory size, I will change innodb_buffer_pool_size from 5GB to 100GB for InnoDB, and rocksdb_block_cache_size for MyRocks.
我将会把InnoDB的innodb_buffer_pool_size参数和MyRocks的rocksdb_block_cache_size参数从5GB改到100GB。
For MyRocks we will use LZ4 as the default compression on disk. The data size in the MyRocks storage engine is 21GB. Interesting to note, that in MyRocks uncompressed size is 70GB on the storage.
对于MyRocks引擎,我会用LZ4压缩。数据量大小是21GB,在不压缩情况下是70GB。
For both engines, I did not use FOREIGN KEYS, as MyRocks does not support it at the moment.
对于这两个引擎,我没有使用外键,因为MyRocks目前还不支持。
MyRocks does not support SELECT .. FOR UPDATE statements in REPEATABLE-READ mode in the Percona Server for MySQL implementation. However, “SELECT .. FOR UPDATE” is used in this benchmark. So I had to use READ-COMMITTED mode, which is supported.
在percona serserver 分支MySQL实现中,MyRocks在可重复度模式下不支持select ..for update 语句。然而,在基准测试中使用到了 “SELECT .. FOR UPDATE”。所以我必须使用支持该语句的READ-COMMITTED模式。
The most important setting I used was to enable binary logs, for the following reasons:
我使用的最重要的设置是启用了binary logs,原因如下:
1. Any serious production uses binary logs
2. With disabled binary logs, MyRocks is affected by a suboptimal transaction coordinator
1.生产环境一般都启用binary logs。
2.如果不启动binary logs,MyRocks将会受到suboptimal transaction coordinator影响。
I used the following settings for binary logs:
binlog_format = ‘ROW’
binlog_row_image=minimal
sync_binlog=10000 (I am not using 0, as this causes serious stalls during binary log rotations, when the content of binary log is flushed to storage all at once)
我对二进制日志使用了如下配置
binlog_format = ‘ROW’
binlog_row_image=minimal
sync_binlog=10000 (这个参数不设置0,因为在binary log日志刷新到存储的时候会造成严重的停顿)
While I am not a full expert in MyRocks tuning yet, I used recommendations from this page: https://github.com/facebook/mysql-5.6/wiki/my.cnf-tuning. The Facebook-MyRocks engineering team also provided me input on the best settings for MyRocks.
虽然我现在对MyRocks调优不是很熟悉,但我使用了如下博客的建议:https://github.com/facebook/mysql-5.6/wiki/my.cnf-tuning . Facebook-MyRocks引擎团队也给了我最优设置的建议。
Let’s review the results for different memory sizes.
让我们回顾一下不同内存大小的测试结果
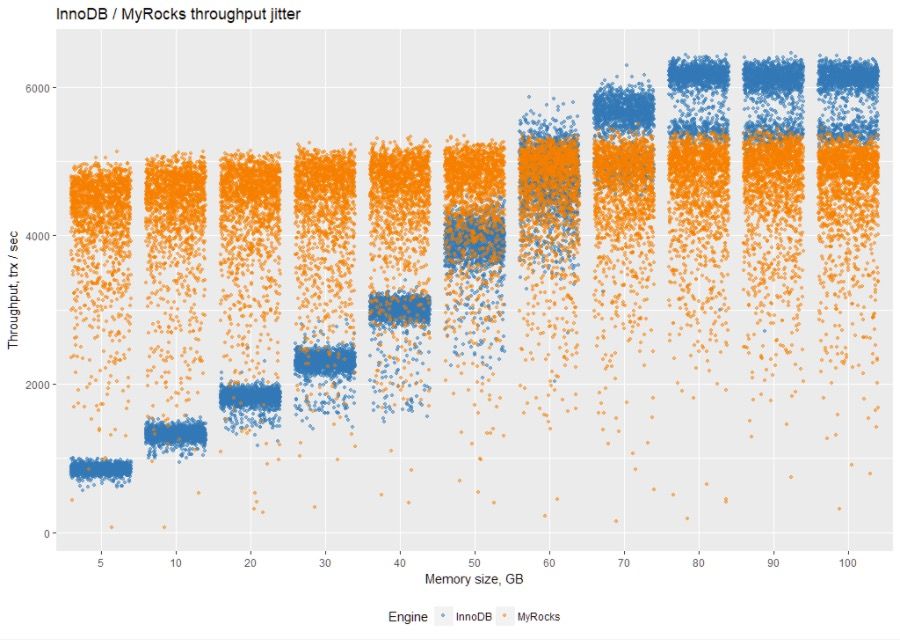
This first chart shows throughput jitter. This helps to understand the distribution of throughput results. Throughput is measured every 1 second, and on the chart I show all measurements after 2000 seconds of a run (the total length of each run is 3600 seconds). So I show the last 1600 seconds of each run (to remove warm-up phases):
第一个图表显示了吞吐抖动,能帮助理解吞吐量结果的分布,每秒测量一次吞吐量,在下面的图表上显示了在运行了2000秒后所有的测量结果(每次测试运行3600秒),所以我显示了每次运行的最后1600秒(消除热身阶段)
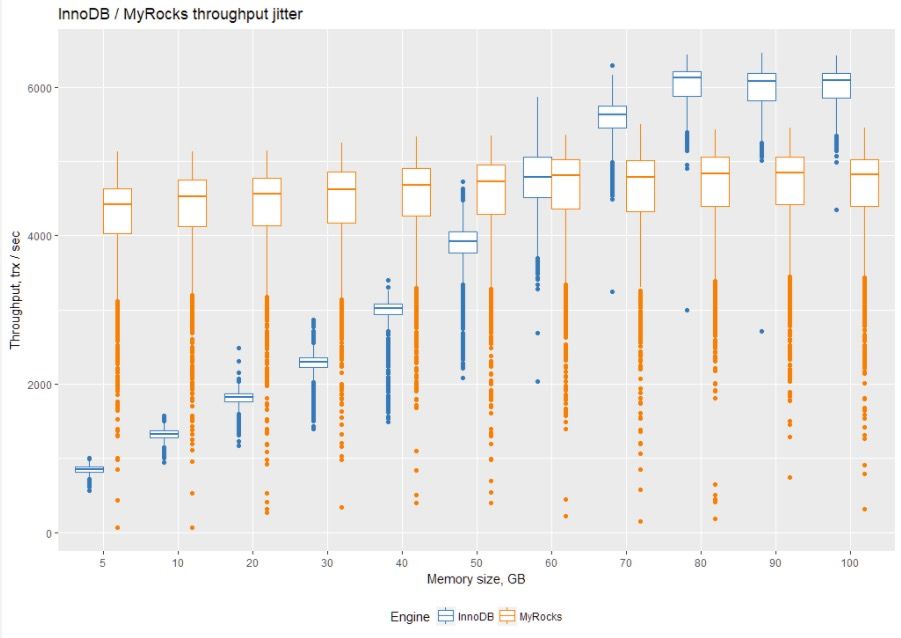
To better quantify results, let’s take a look at them on a boxplot. The quickest way to understand boxplots is to take a look at the middle line. It represents a median of measurements (see more at https://www.percona.com/blog/2012/02/23/some-fun-with-r-visualization/):
为了更好的量化结果,我们来看一下盒形图。看中间线是最快的办法看懂盒形图。它体现了测量的中值。(更多内容请查看https://www.percona.com/blog/2012/02/23/some-fun-with-r-visualization/):
Before we jump to the summary of results, let’s take a look at a variation of the throughput for both InnoDB and MyRocks. We will zoom to a 1-second resolution chart for 100 GB of allocated memory:
在开始总结之前,让我们看看InnoDB和MyRocks的吞吐量变化。对于100GB的内存分配,我们将放大到1秒分辨率图表:
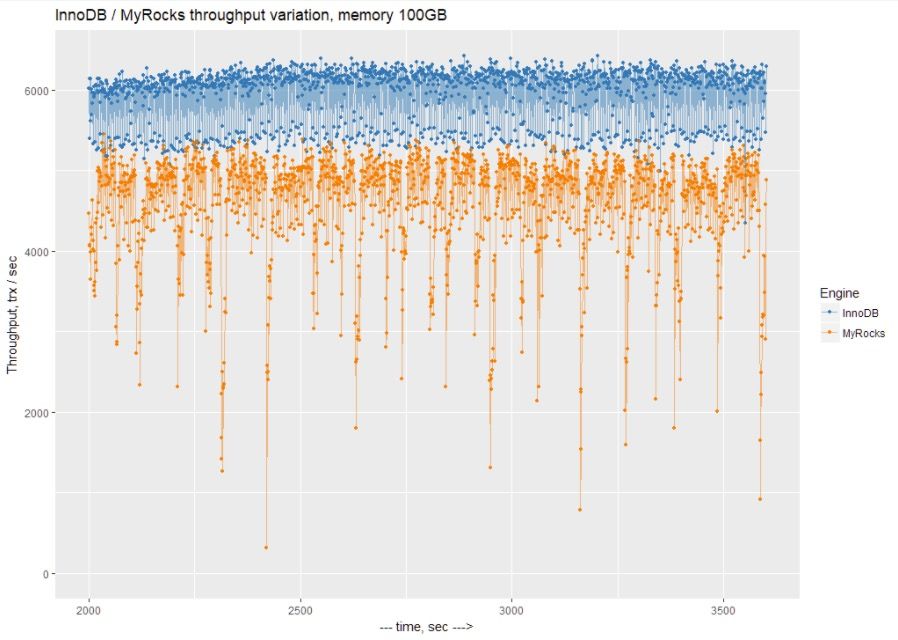
We can see that there is a lot of variation with periodical 1-second performance drops with MyRocks. At this moment, I do not know what causes these drops.
我们可以看到,MyRocks的1秒周期性能下降有很大的变化。现在,我不知道是什么原因导致了这些下降。
So let’s take a look at the average throughput for each engine for different memory settings (the results are in tps, and more is better):
再看看不同内存设置下每个引擎的平均吞吐量(结果是TPS,结果越大性能越好):
Memory, GB
InnoDB
MyRocks
5
849.0664
4205.714
10
1321.9
4298.217
20
1808.236
4333.424
30
2275.403
4394.413
40
2968.101
4459.578
50
3867.625
4503.215
60
4756.551
4571.163
70
5527.853
4576.867
80
5984.642
4616.538
90
5949.249
4620.87
100
5961.2
4599.143
This is where MyRocks behaves differently from InnoDB. InnoDB benefits greatly from additional memory, up to the size of working dataset. After that, there is no reason to add more memory.
这个就是MyRocks和InnoDB表现不同的地方。InnoDB内存越大,性能越好,直到达到工作数据集的大小。在这之后,没有理由再加内存。
At the same time, interestingly MyRocks does not benefit much from additional memory.
与此同时,有趣的是MyRocks性能并没有随着内存增长而提高。
Basically, MyRocks performs as expected for a write-optimized engine. You can refer to my article How Three Fundamental Data Structures Impact Storage and Retrieval for more details.
MyRocks基本上对写优化引擎的性能符合预期,有关更多细节,可以参考我的文章《三种基本数据结构如何影响存储和检索》
In conclusion, InnoDB performs better (compared to itself) when the working dataset fits (or almost fits) into available memory, while MyRocks can operate (and outperform InnoDB) on small memory sizes.
总之当工作数据集适合(或几乎适合)可用内存时,InnoDB的性能更好(与它自己相比),而MyRocks可以在较小的内存大小上运行(并优于InnoDB)。
IO and CPU usage
It is worth looking at resource utilization for each engine. I took vmstat measurements for each run so that we can analyze IO and CPU usage.
值得研究的是每个引擎的资源利用率。我对每次运行都进行了vmstat测量,以便分析IO和CPU使用情况。
First, let’s review writes per second (in KB/sec). Please keep in mind that these writes include binary log writes too, not just writes from the storage engine.
首先,让我们回顾每秒的写操作(单位是KB/sec)。请记住,这些写入还包括二进制日志写入,而不仅仅是来自存储引擎的写入。
Memory, GB
InnoDB
MyRocks
5
244754.4
87401.54
10
290602.5
89874.55
20
311726
93387.05
30
313851.7
93429.92
40
316890.6
94044.94
50
318404.5
96602.42
60
276341.5
94898.08
70
217726.9
97015.82
80
184805.3
96231.51
90
187185.1
96193.6
100
184867.5
97998.26
We can also calculate how many writes per transaction each storage engine performs:
我们也可以计算每个引擎每个事物有多少次写入。
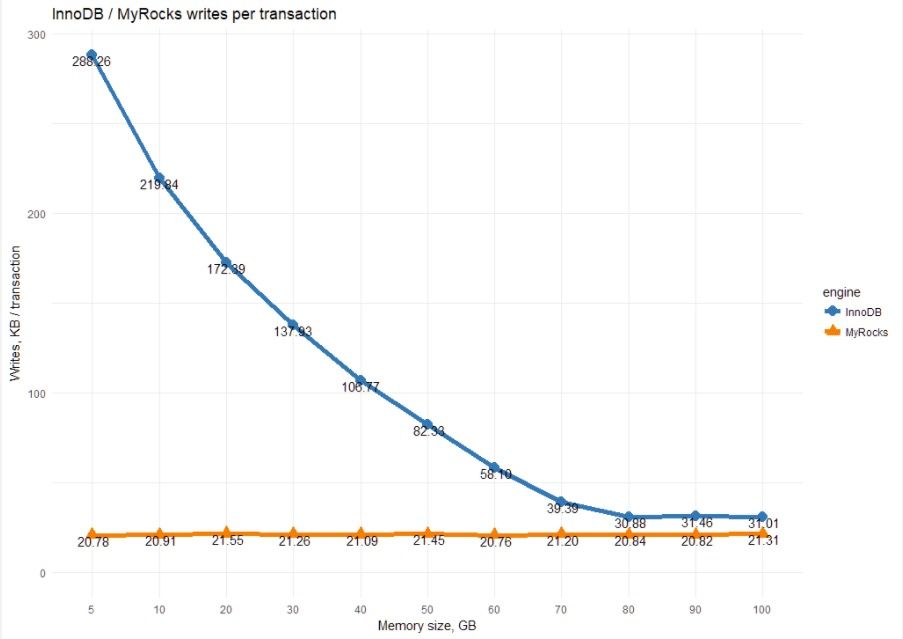
This chart shows the essential difference between InnoDB and MyRocks. MyRocks, being a write-optimized engine, uses a constant amount of writes per transaction.
这个图表显示了InnoDB和MyRocks的本质区别。MyRocks是一个写优化引擎,每个事务使用固定数量的写。
For InnoDB, the amount of writes greatly depends on the memory size. The less memory we have, the more writes it has to perform.
对于InnoDB来说,写的数量很大程度上取决于内存大小。内存越少,需要执行的写操作就越多。
What about reads?
The following table shows reads in KB per second.
如下的表格单位是KB每秒钟
Memory, GB
InnoDB
MyRocks
5
218343.1
171957.77
10
171634.7
146229.82
20
148395.3
125007.81
30
146829.1
110106.87
40
144707
97887.6
50
132858.1
87035.38
60
98371.2
77562.45
70
42532.15
71830.09
80
3479.852
66702.02
90
3811.371
64240.41
100
1998.137
62894.54
We can translate this to the number of reads per transaction:
我们可以将其转换为每个事务的读取次数:
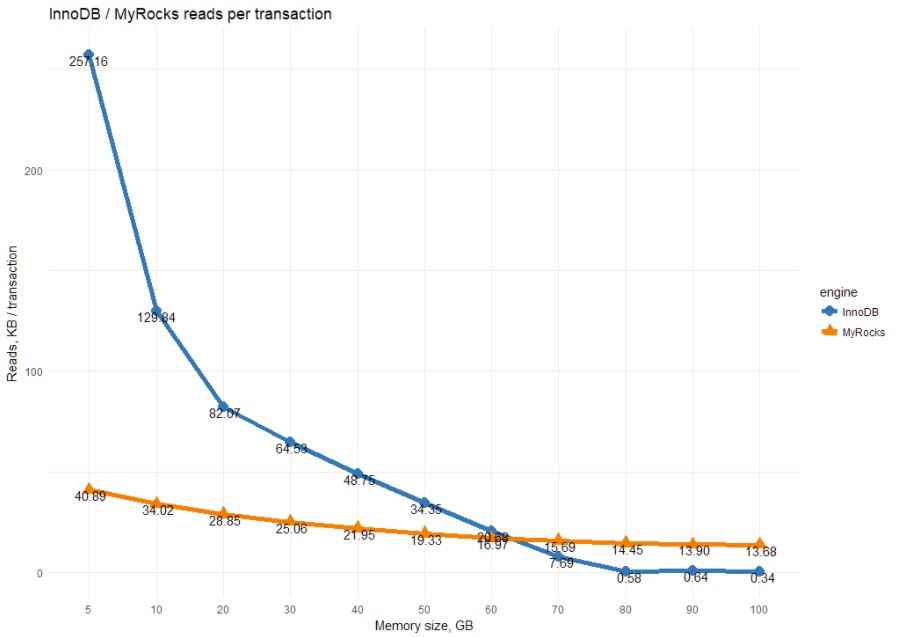
This shows MyRocks’ read-amplification. The allocation of more memory helps to decrease IO reads, but not as much as for InnoDB.
这显示了MyRocks的读取放大功能。分配更多的内存有助于减少IO的读取,但没有InnoDB那么多。
CPU usage
Let’s also review CPU usage for each storage engine. Let’s start with InnoDB:
再回顾一下每个存储引擎的CPU使用情况。让我们从InnoDB开始:
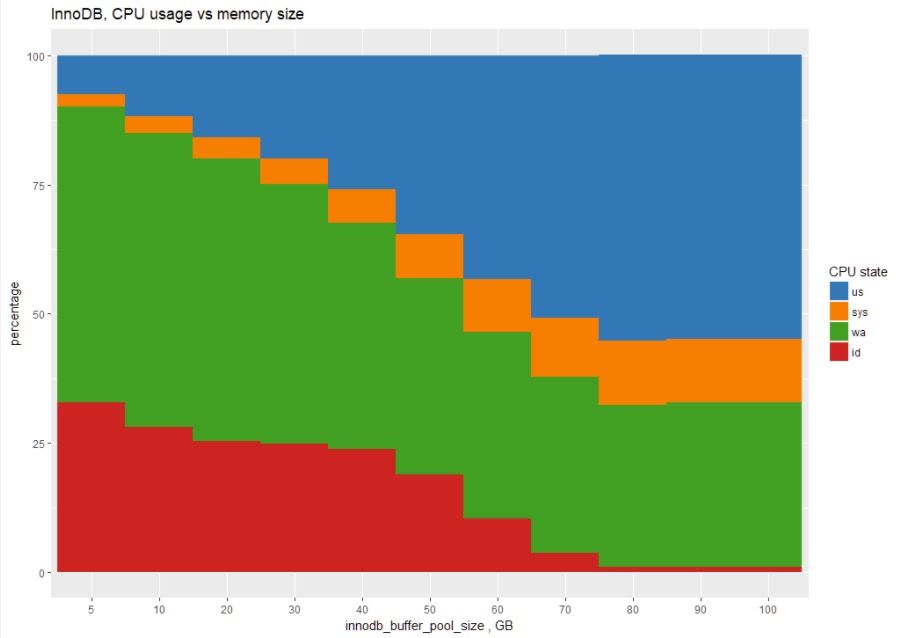
The chart shows that for 5GB memory size, InnoDB spends most of its time in IO waits (green area), and the CPU usage (blue area) increases with more memory.
图表显示,对于5GB内存大小,InnoDB在IO等待中花费的时间最多(绿色区域),而CPU使用(蓝色区域)随着内存的增加而增加。
This is the same chart for MyRocks:
这是MyRocks的相同图表:
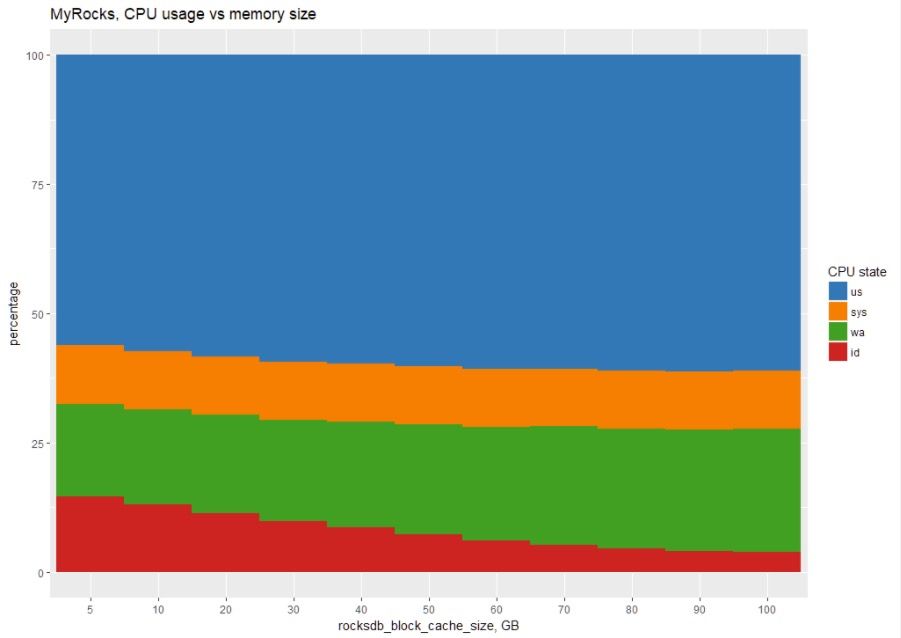
In tabular form:
表格如下:
Memory, GB
engine
us
sys
wa
id
5
InnoDB
8
2
57
33
5
MyRocks
56
11
18
15
10
InnoDB
12
3
57
28
10
MyRocks
57
11
18
13
20
InnoDB
16
4
55
25
20
MyRocks
58
11
19
11
30
InnoDB
20
5
50
25
30
MyRocks
59
11
19
10
40
InnoDB
26
7
44
24
40
MyRocks
60
11
20
9
50
InnoDB
35
8
38
19
50
MyRocks
60
11
21
7
60
InnoDB
43
10
36
10
60
MyRocks
61
11
22
6
70
InnoDB
51
12
34
4
70
MyRocks
61
11
23
5
80
InnoDB
55
12
31
1
80
MyRocks
61
11
23
5
90
InnoDB
55
12
32
1
90
MyRocks
61
11
23
4
100
InnoDB
55
12
32
1
100
MyRocks
61
11
24
4
We can see that MyRocks uses a lot of CPU (in us+sys state) no matter how much memory is allocated. This leads to the conclusion that MyRocks performance is limited more by CPU performance than by available memory.
我们可以看到,无论分配多少内存,MyRocks都会使用大量CPU(在us+sys状态下)。由此得出结论,MyRocks的性能更多地受到CPU性能的限制,而不是可用内存的限制。
MyRocks directory size
As MyRocks writes all changes and compacts SST files down the road, it would be interesting to see how the data directory size changes during the benchmark so we can estimate our storage needs. Here is a chart of datadirectory size:
当MyRocks写入所有数据和压缩SST文件一段时间之后,可以观察在基准测试期间数据目录大小是如何变化的,这样我们就可以估计存储需求。下面是数据目录大小的图表:
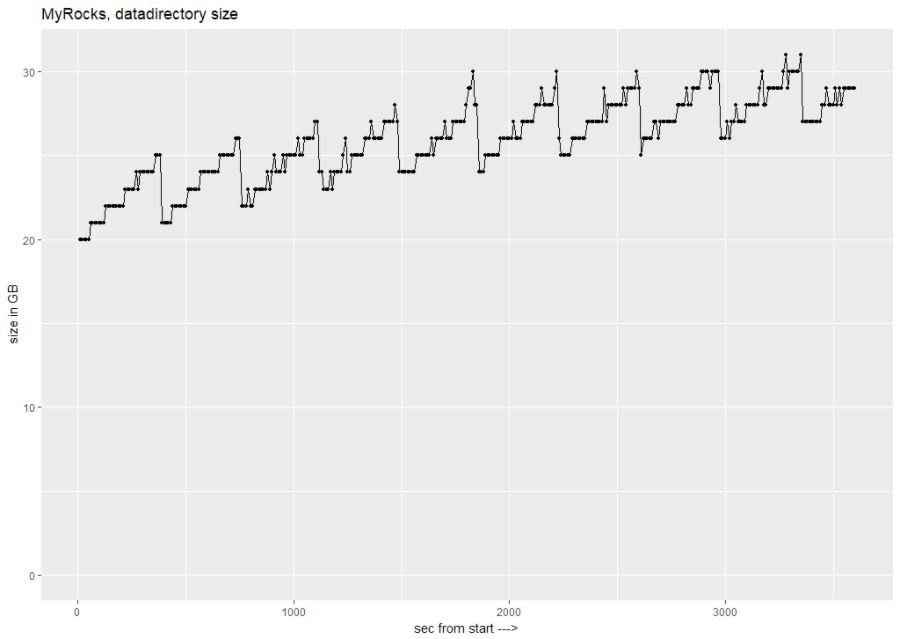
We can see that datadirectory goes from 20GB at the start, to 31GB during the benchmark. It is interesting to observe the data growing until compaction shrinks it.
我们可以看到数据目录从开始的20GB增加到基准测试期间的31GB。观察数据在压缩前的增长是很有趣的。
Conclusion
In conclusion, I can say that MyRocks performance increases as the ratio of dataset size to memory increases, outperforming InnoDB by almost five times in the case of 5GB memory allocation. Throughput variation is something to be concerned about, but I hope this gets improved in the future.
总之,我可以说MyRocks的性能随着数据集大小与内存的比例的增加而提高,在5GB内存分配的情况下,其性能比InnoDB高出近5倍。吞吐量变化是需要关注的问题,但我希望将来能提高。
MyRocks does not require a lot of memory and shows constant write IO, while using most of the CPU resources.
MyRocks不需要很多内存,并且在使用大多数CPU资源的情况下,显示恒定的写IO。
I think this potentially makes MyRocks a great choice for cloud database instances, where both memory and IO can cost a lot. MyRocks deployments would make it cheaper to deploy in the cloud.
我认为这可能会使MyRocks成为云数据库实例的一个很好的选择,因为在云数据库实例中,内存和IO的成本都很高。MyRocks的部署将会降低部署在云端的成本。
I will follow up with further cloud-oriented benchmarks.
我将进一步跟进面向云的基准测试。
Extras
额外部分
Raw results, scripts and config
原始结果、脚本和配置
My goal is to provide fully repeatable benchmarks. To this end, I’m sharing all the scripts and settings I used in the following GitHub repo:
我的目标是提供完全可重复的基准测试。为此,我将共享我在以下GitHub repo中使用的所有脚本和设置:
https://github.com/Percona-Lab-results/201803-sysbench-tpcc-myrocks
MyRocks settings
MyRocks设置
rocksdb_max_open_files=-1rocksdb_max_background_jobs=8rocksdb_max_total_wal_size=4Grocksdb_block_size=16384rocksdb_table_cache_numshardbits=6# rate limiterrocksdb_bytes_per_sync=16777216rocksdb_wal_bytes_per_sync=4194304rocksdb_compaction_sequential_deletes_count_sd=1rocksdb_compaction_sequential_deletes=199999rocksdb_compaction_sequential_deletes_window=200000rocksdb_default_cf_options="write_buffer_size=256m;target_file_size_base=32m;max_bytes_for_level_base=512m;max_write_buffer_number=4;level0_file_num_compaction_trigger=4;level0_slowdown_writes_trigger=20;level0_stop_writes_trigger=30;max_write_buffer_number=4;block_based_table_factory={cache_index_and_filter_blocks=1;filter_policy=bloomfilter:10:false;whole_key_filtering=0};level_compaction_dynamic_level_bytes=true;optimize_filters_for_hits=true;memtable_prefix_bloom_size_ratio=0.05;prefix_extractor=capped:12;compaction_pri=kMinOverlappingRatio;compression=kLZ4Compression;bottommost_compression=kLZ4Compression;compression_opts=-14:4:0"rocksdb_max_subcompactions=4rocksdb_compaction_readahead_size=16mrocksdb_use_direct_reads=ONrocksdb_use_direct_io_for_flush_and_compaction=ON
InnoDB settings
InnoDB设置
# filesinnodb_file_per_tableinnodb_log_file_size=15Ginnodb_log_files_in_group=2innodb_open_files=4000# buffersinnodb_buffer_pool_size= 200Ginnodb_buffer_pool_instances=8innodb_log_buffer_size=64M# tuneinnodb_doublewrite= 1innodb_support_xa=0innodb_thread_concurrency=0innodb_flush_log_at_trx_commit= 1innodb_flush_method=O_DIRECT_NO_FSYNCinnodb_max_dirty_pages_pct=90innodb_max_dirty_pages_pct_lwm=10innodb_lru_scan_depth=1024innodb_page_cleaners=4join_buffer_size=256Ksort_buffer_size=256Kinnodb_use_native_aio=1innodb_stats_persistent = 1#innodb_spin_wait_delay=96# perf specialinnodb_adaptive_flushing = 1innodb_flush_neighbors = 0innodb_read_io_threads = 4innodb_write_io_threads = 2innodb_io_capacity=2000innodb_io_capacity_max=4000innodb_purge_threads=4innodb_adaptive_hash_index=1
Hardware spec
硬件规格
Supermicro server:
.CPU: Intel(R) Xeon(R) CPU E5-2683 v3 @ 2.00GHz 2 sockets / 28 cores / 56 threads.Memory: 256GB of RAM.Storage: SAMSUNG SM863 1.9TB Enterprise SSD.Filesystem: ext4.Percona-Server-5.7.21-20.OS: Ubuntu 16.04.4, kernel 4.13.0-36-generic
You May Also Like
你可能也喜欢
For a detailed look at how MyRocks stacks up against typical InnoDB deployments, read my blog MyRocks Engine: Things to Know Before You Start. We go over the differences, major and minor, in the storage engine and discuss its implementation with Percona Server. MyRocks could also be beneficial for your cloud deployment. Saving With MyRocks in The Cloud shows how the storage engine performed under heavy I-O workloads in the cloud and what that means for your storage costs.
要详细了解MyRocks和InnoDB部署有什么区别,请阅读我的博客MyRocks Engine:在开始之前需要了解的内容。我们将讨论存储引擎中的主要和次要差异,并在Percona服务器中讨论其实现。MyRocks还可以为您的云部署提供帮助。使用云中的MyRocks显示了存储引擎在云中的大量IO工作负载下的性能,以及这对存储成本的影响。
END


扫码加入MySQL技术Q群
(群号:****529671799)

本文分享自微信公众号 - 老叶茶馆(iMySQL_WX)。
如有侵权,请联系 support@oschina.cn 删除。
本文参与“OSC源创计划”,欢迎正在阅读的你也加入,一起分享。


